
The vernal pool we have been monitoring has been dry since about June 17. There were a couple of rainy days in late June, but the puddles formed did not last more than a day. The pool was dry when I visited on July 10, September 29, and October 23. That is, there was no standing water, but the soil under the leaves was always damp. New data from the water depth datalogger indicate that only two rainfall events between June 30 and October 23 produced standing water in the pool.

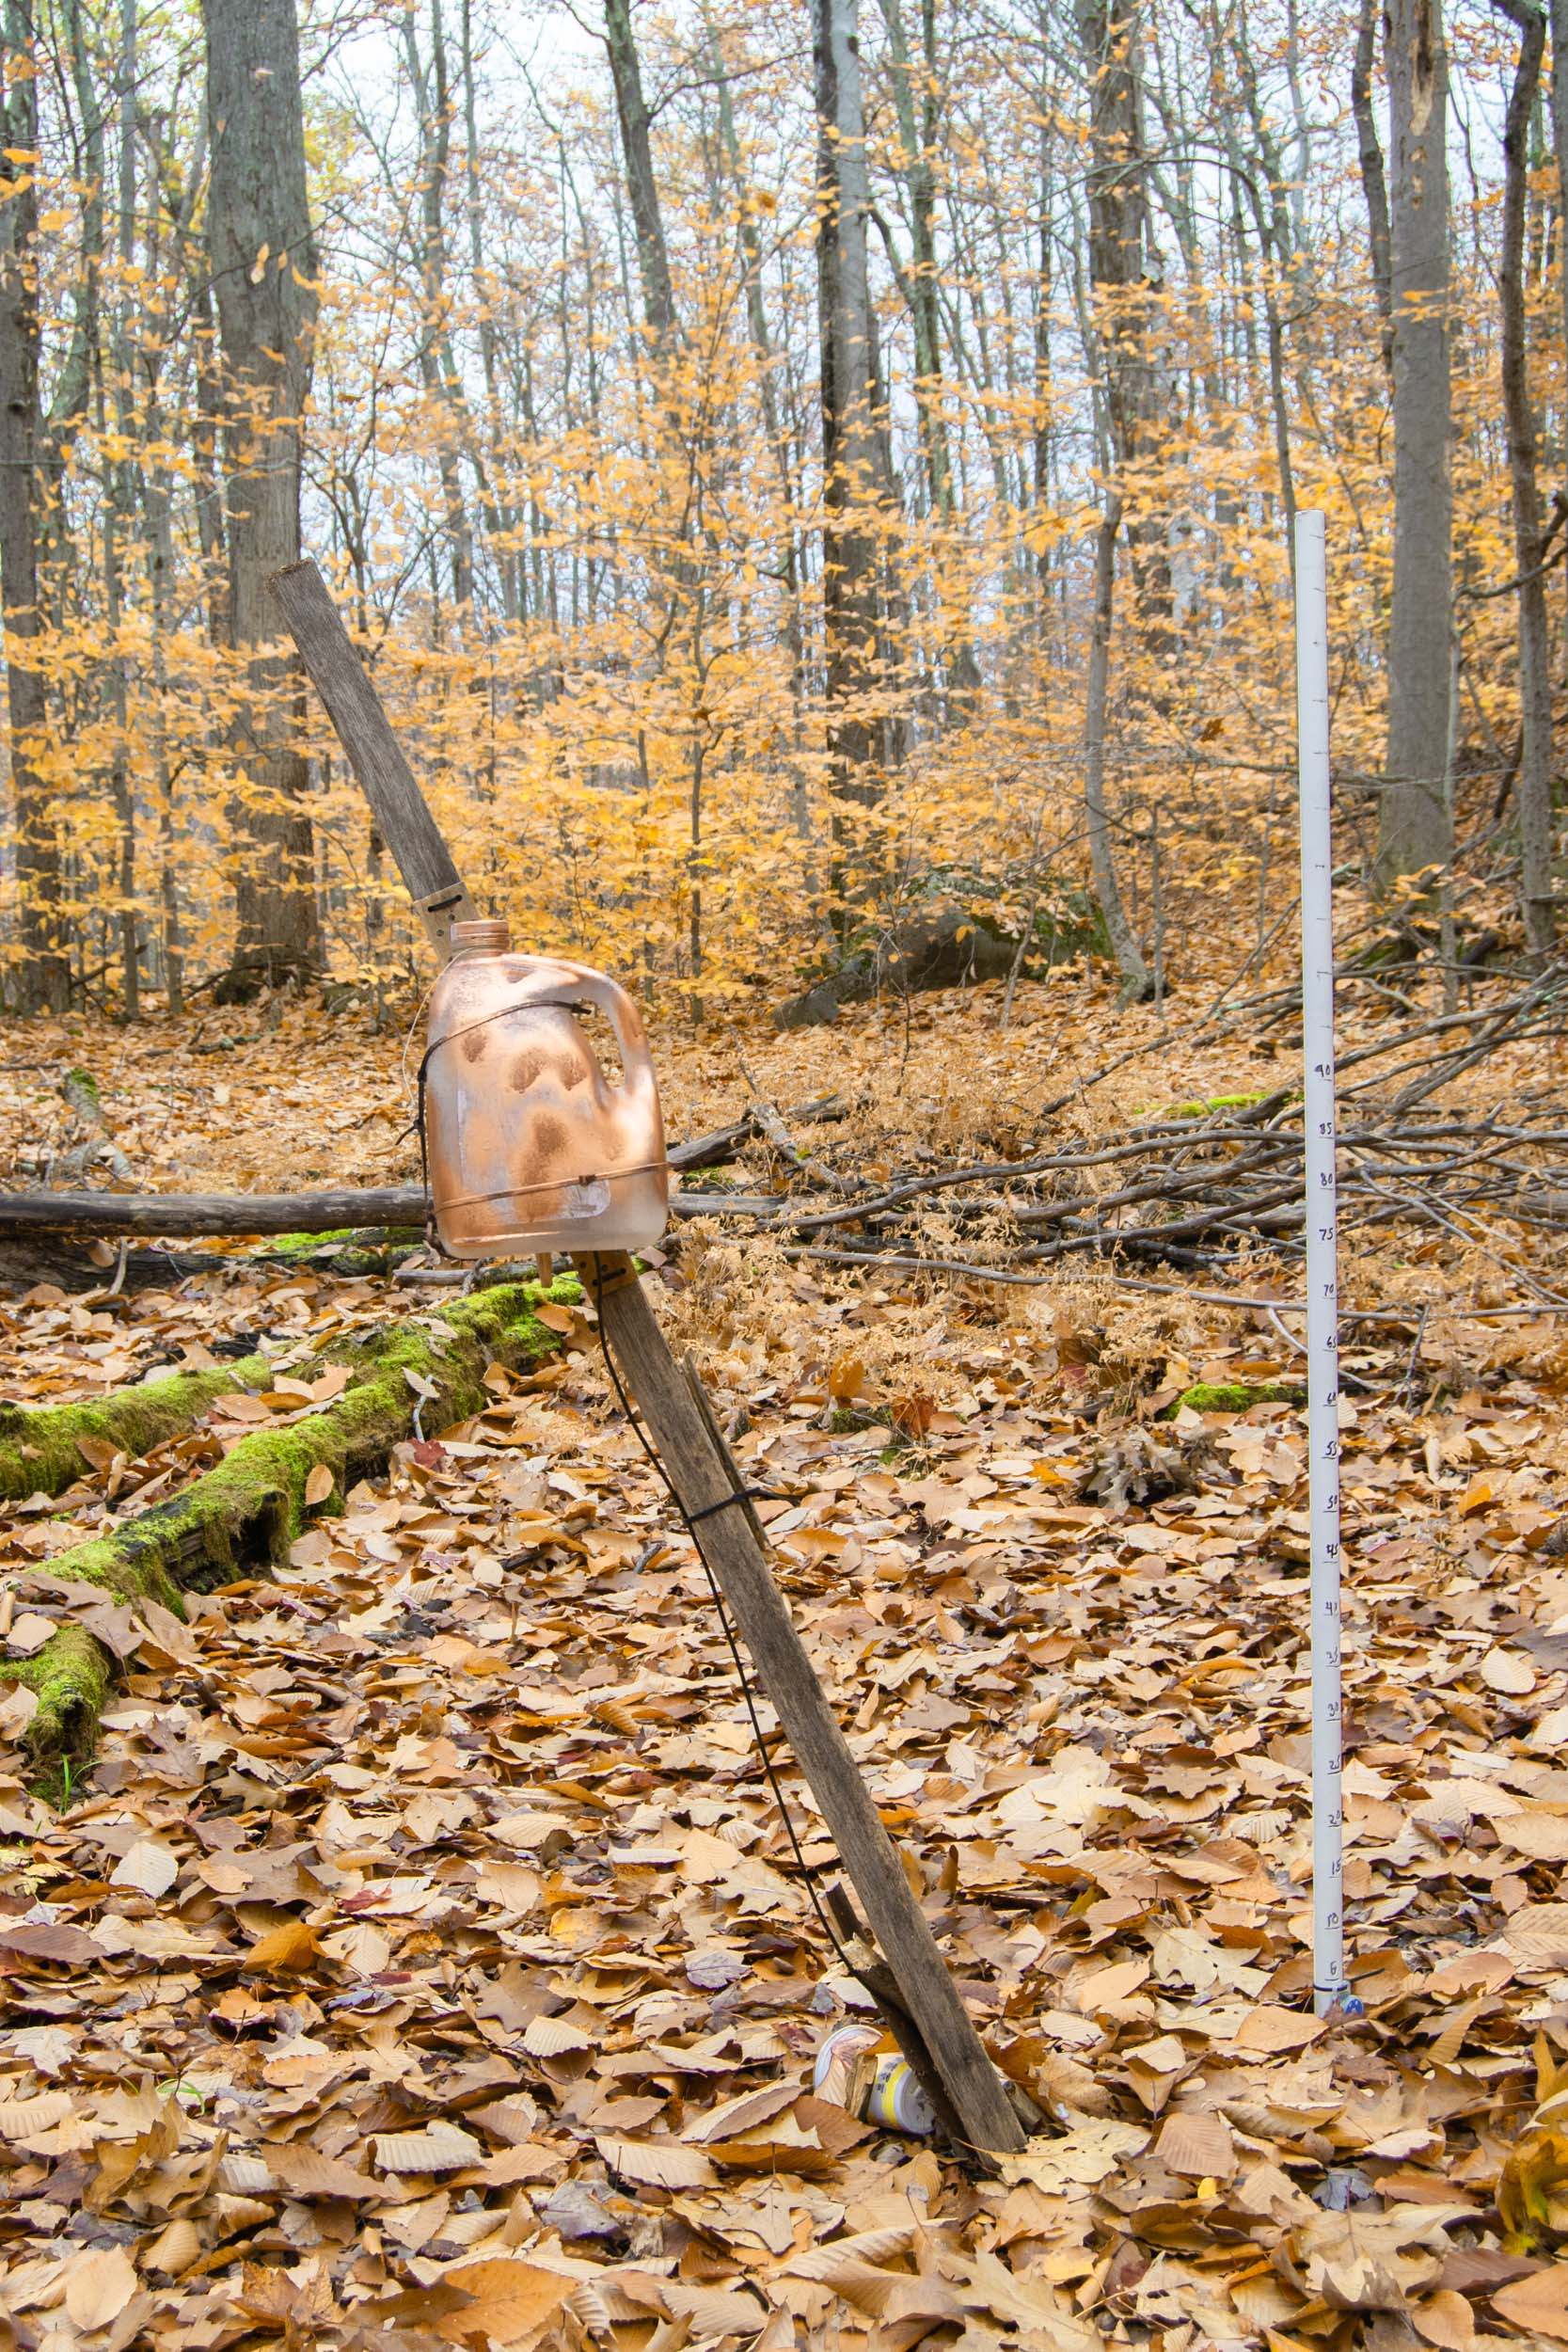
I swapped batteries and the SD card on October 23 and have a complete record since the last report (July 12) of air temperature, humidity, barometric pressure, temperature at ground level (which is water temperature when there is water), and water depth. The datalogger in the pool is described here.

Only two storms during this period produced more than 1.2 inches of rain (Figure 2, bottom). The first was tropical storm Isaias on August 4. Isaias and a September 30 rainstorm both created puddles under the water depth monitor. Water depth grew to about 9-10 cm but within a day the puddles were undetectable from the ultrasonic noise of a dry, leafy pool bottom.
The two rain events did not leave a signal in the “water” temperature data (Figure 2, top). The sensor on the pool bottom must have been under water, but there was no obvious difference in temperature between that sensor and the one under the plastic jug three feet above the pool bottom. I assume this was because the water temperature was not very different from the air temperature.
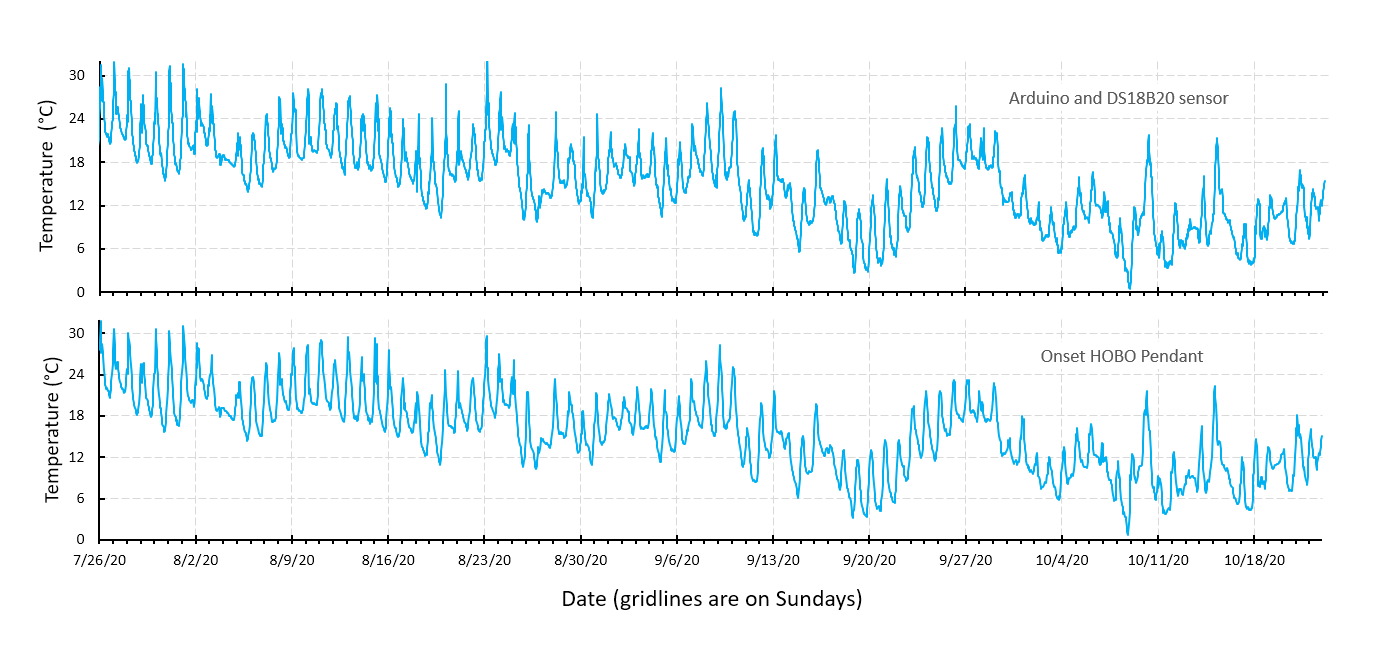
The lack of a signal in the temperature data for the presence of standing water puzzled me, so I compared the result from the cabled sensor on the water depth logger with the record from the HOBO temperature logger (Figure 3). The two records are eerily similar, so I’m sticking with my hypothesis that when it rains in the summer the temperature of a puddle is the same as the air temperature.
In mid-July, measured air temperature exceeded 100°F (37.7°C) on nine days (Figure 2, top). This temperature sensor is exposed to the air under a bottomless, transparent jug and I assume these were sunny days when heated air collected under the jug. Inside the closed, clear-plastic peanut butter jar where the electronics are housed, another sensor (on the real-time clock) recorded 15 days with temperature greater than 37.7°C, and half of those days were between 43° and 49°C (109°-120°F). This is a good example of the greenhouse effect (light energy gets in but the hot air it produces is trapped). The 3D printed mounting plate for the electronics deformed due to this heat.
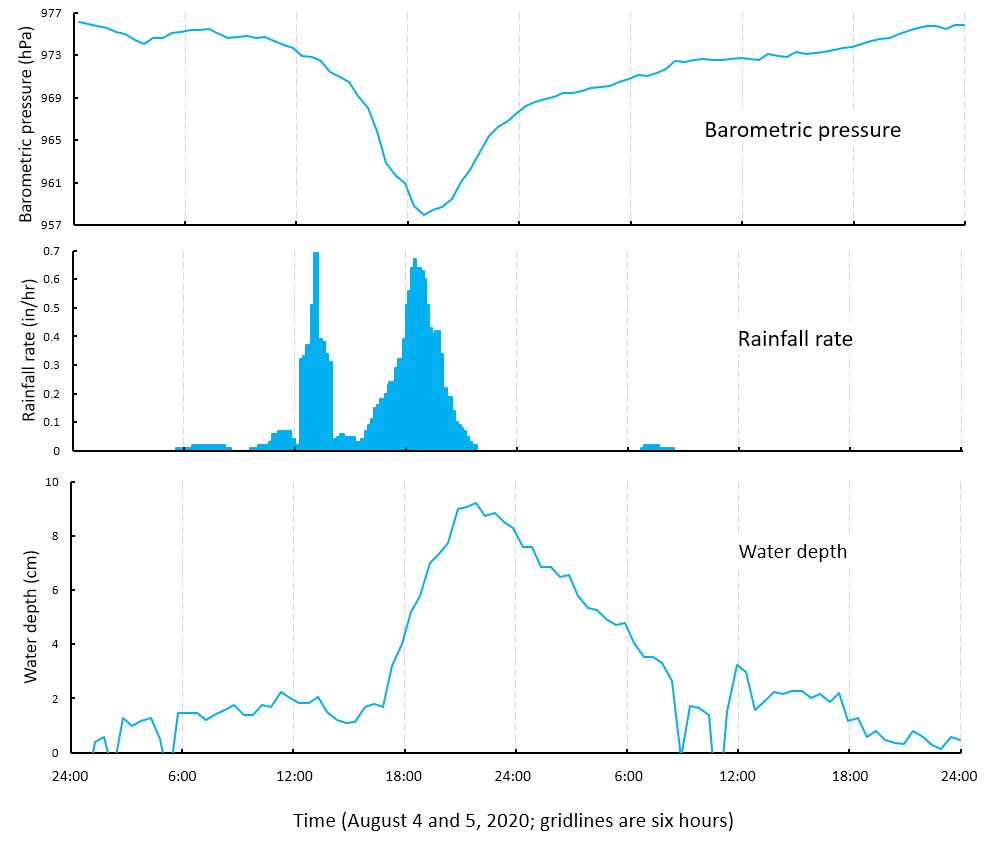

The two major rain events since June had similar impacts on the vernal pool (Figures 4 and 5). Although only the August 4 event was a remnant of a tropical storm, both storms were brought by strong low pressure systems which tracked north along the eastern seaboard before entering New England. Both storms dropped 6 to 8 cm (2.5 to 3 in) of rain near the vernal pool within a 12 hour period. Water depth in the vernal pool did not begin to increase until several hours into the two rain events. Water depth started to drop as soon as the rain events ended and the pool was probably almost dry again 12 hours later.
The short-lived impact of these storms on vernal pool water depth probably tells us something important about the hydrology of the pool. Middlebury gets about 1 m of precipitation per year, and each of these storms was about 8% of the annual total, or one month’s share. One month’s worth of rain flooded part of the pool basin for only a single day. How many months’ worth of rain are needed before the pool starts to maintain a reasonable water depth? There are only five months to go before the salamanders show up again!
Maybe the important lesson about this vernal pool is that it is rather leaky. It seems to leak so much that average monthly rain might never be enough to keep it full. Filling up the soil and groundwater reservoirs will help, but the pool is near the top of a hill and has a tiny watershed (2 acres), so we can’t depend on a constant contribution from groundwater storage. The best hope for filling the pool is an influx of snowmelt (a couple of months of stored precipitation all at once) plus late winter rain. The best hope for keeping it full is regular springtime rain. If that rain stops in May or June, like it did this year, even a snowy, damp winter might not keep the pool wet enough to allow new amphibians to escape.

Hi, Chris–
Interesting article!
I remember when you looked for insects on the golf course behind your house in Maryland.
I thought I would say “hi”! HI:)