On May 3 we made the official third visit to the vernal pool we are monitoring. During this visit we are supposed to collect the frog call recorder and do the final surveys for amphibian eggs and aquatic invertebrates. At the second visit we failed to find any fairy shrimp, so I was looking forward to adding them to my crustacean life list. I was also looking forward to collecting the microSD card from the data logger we had installed on April 17 and examining two more weeks worth of data. And at the last minute I decided to bring a 24 foot-long pole and get some “aerial” photos from above the pool. By the time we left the pool to hike back to the road, I was dismayed at my lack of success at most of these goals.
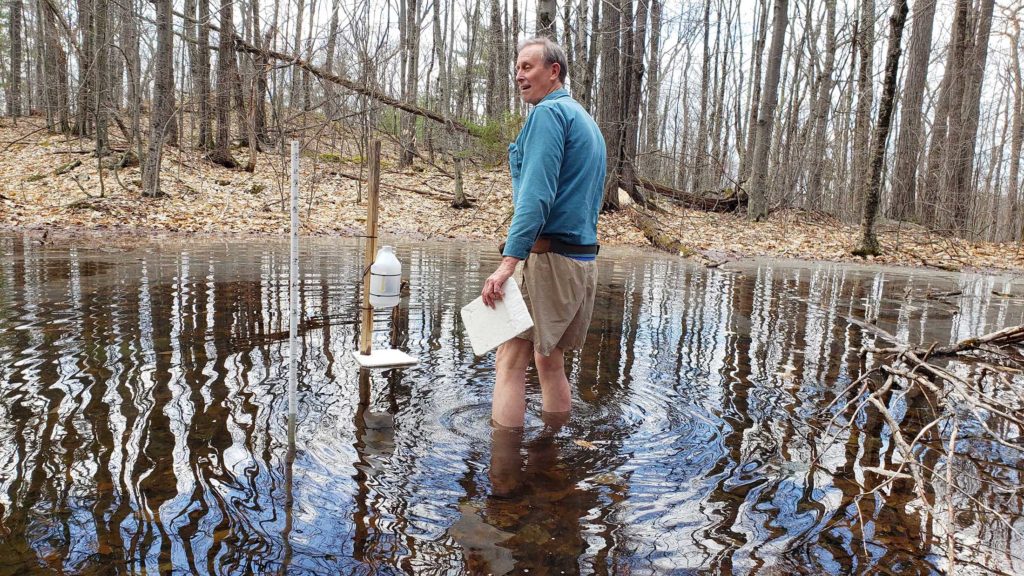
Ned brought his waders and I didn’t, but somehow I was the one wading out to install the new version of the data logger. Photo by Ned, May 3, 2020.
When I extracted the data logger from under the jug and inside the peanut butter jar, the LED on the Adafruit Feather was blinking. I knew that was a bad sign and probably meant that no data were being saved. I swapped out the microSD card and restarted the logger and it seemed to be operating normally. I wouldn’t know until I got home whether any data had been saved in the time since we deployed the logger two weeks earlier.
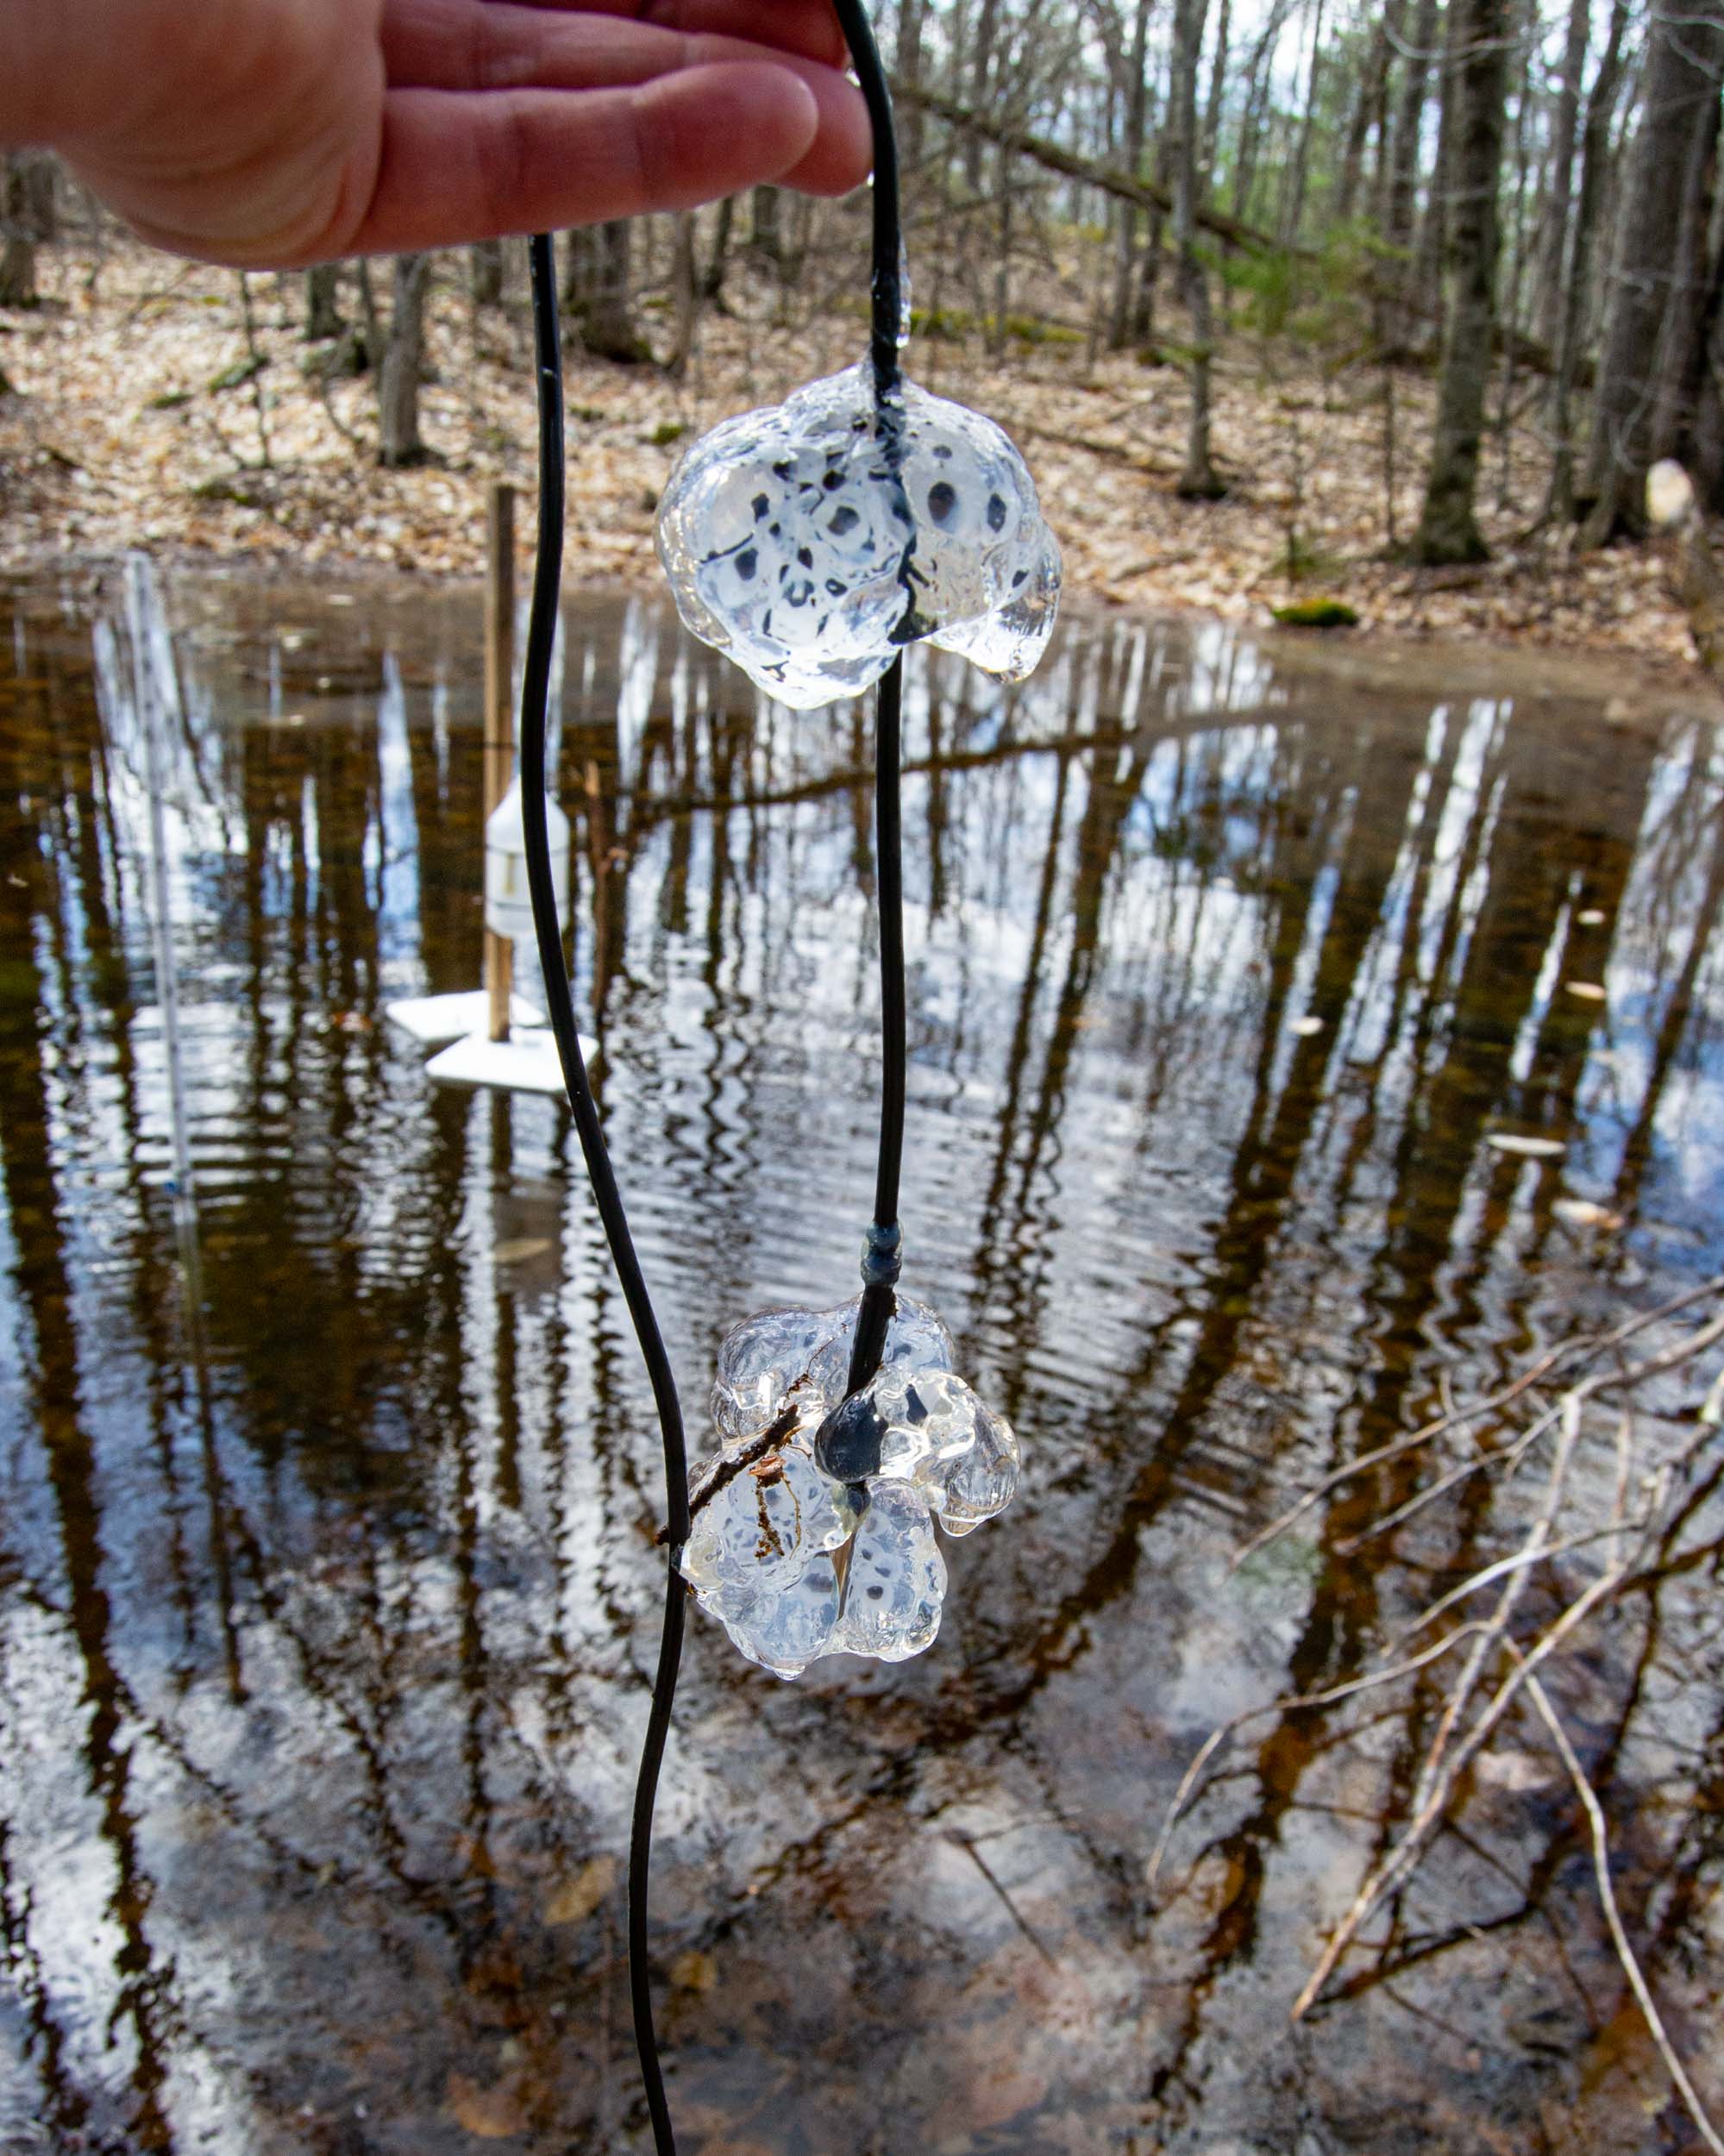
On May 3 we learned that spotted salamanders had attached egg masses to the water temperature sensor we had installed on April 17. We founds lots of egg masses on April 17, but these new egg masses confirmed that salamanders were depositing eggs after that time. Our amphibian egg surveys also found more spotted salamander egg masses on May 3 than on April 17.
At home I found that the data logger had indeed stopped working, but not until the morning of this visit. The logger had flawlessly saved data every 30 minutes for 16 days and then stopped a few hours before we arrived (as usual, my skills are generally indistinguishable from luck). I guessed that the problem was battery power. The battery pack of three rechargeable AA batteries supplies a nominal 3.6 volts, but as the batteries run down the voltage drops. When the microcontroller (Adafruit Feather) gets insufficient voltage it resets itself. I think it was constantly starting and stopping which would explain the blinking LED. A possible fix was to replace the rechargeable batteries (1.2 volts apiece) with alkaline batteries (1.5 volts apiece). So an emergency mission back to the pool was planned.
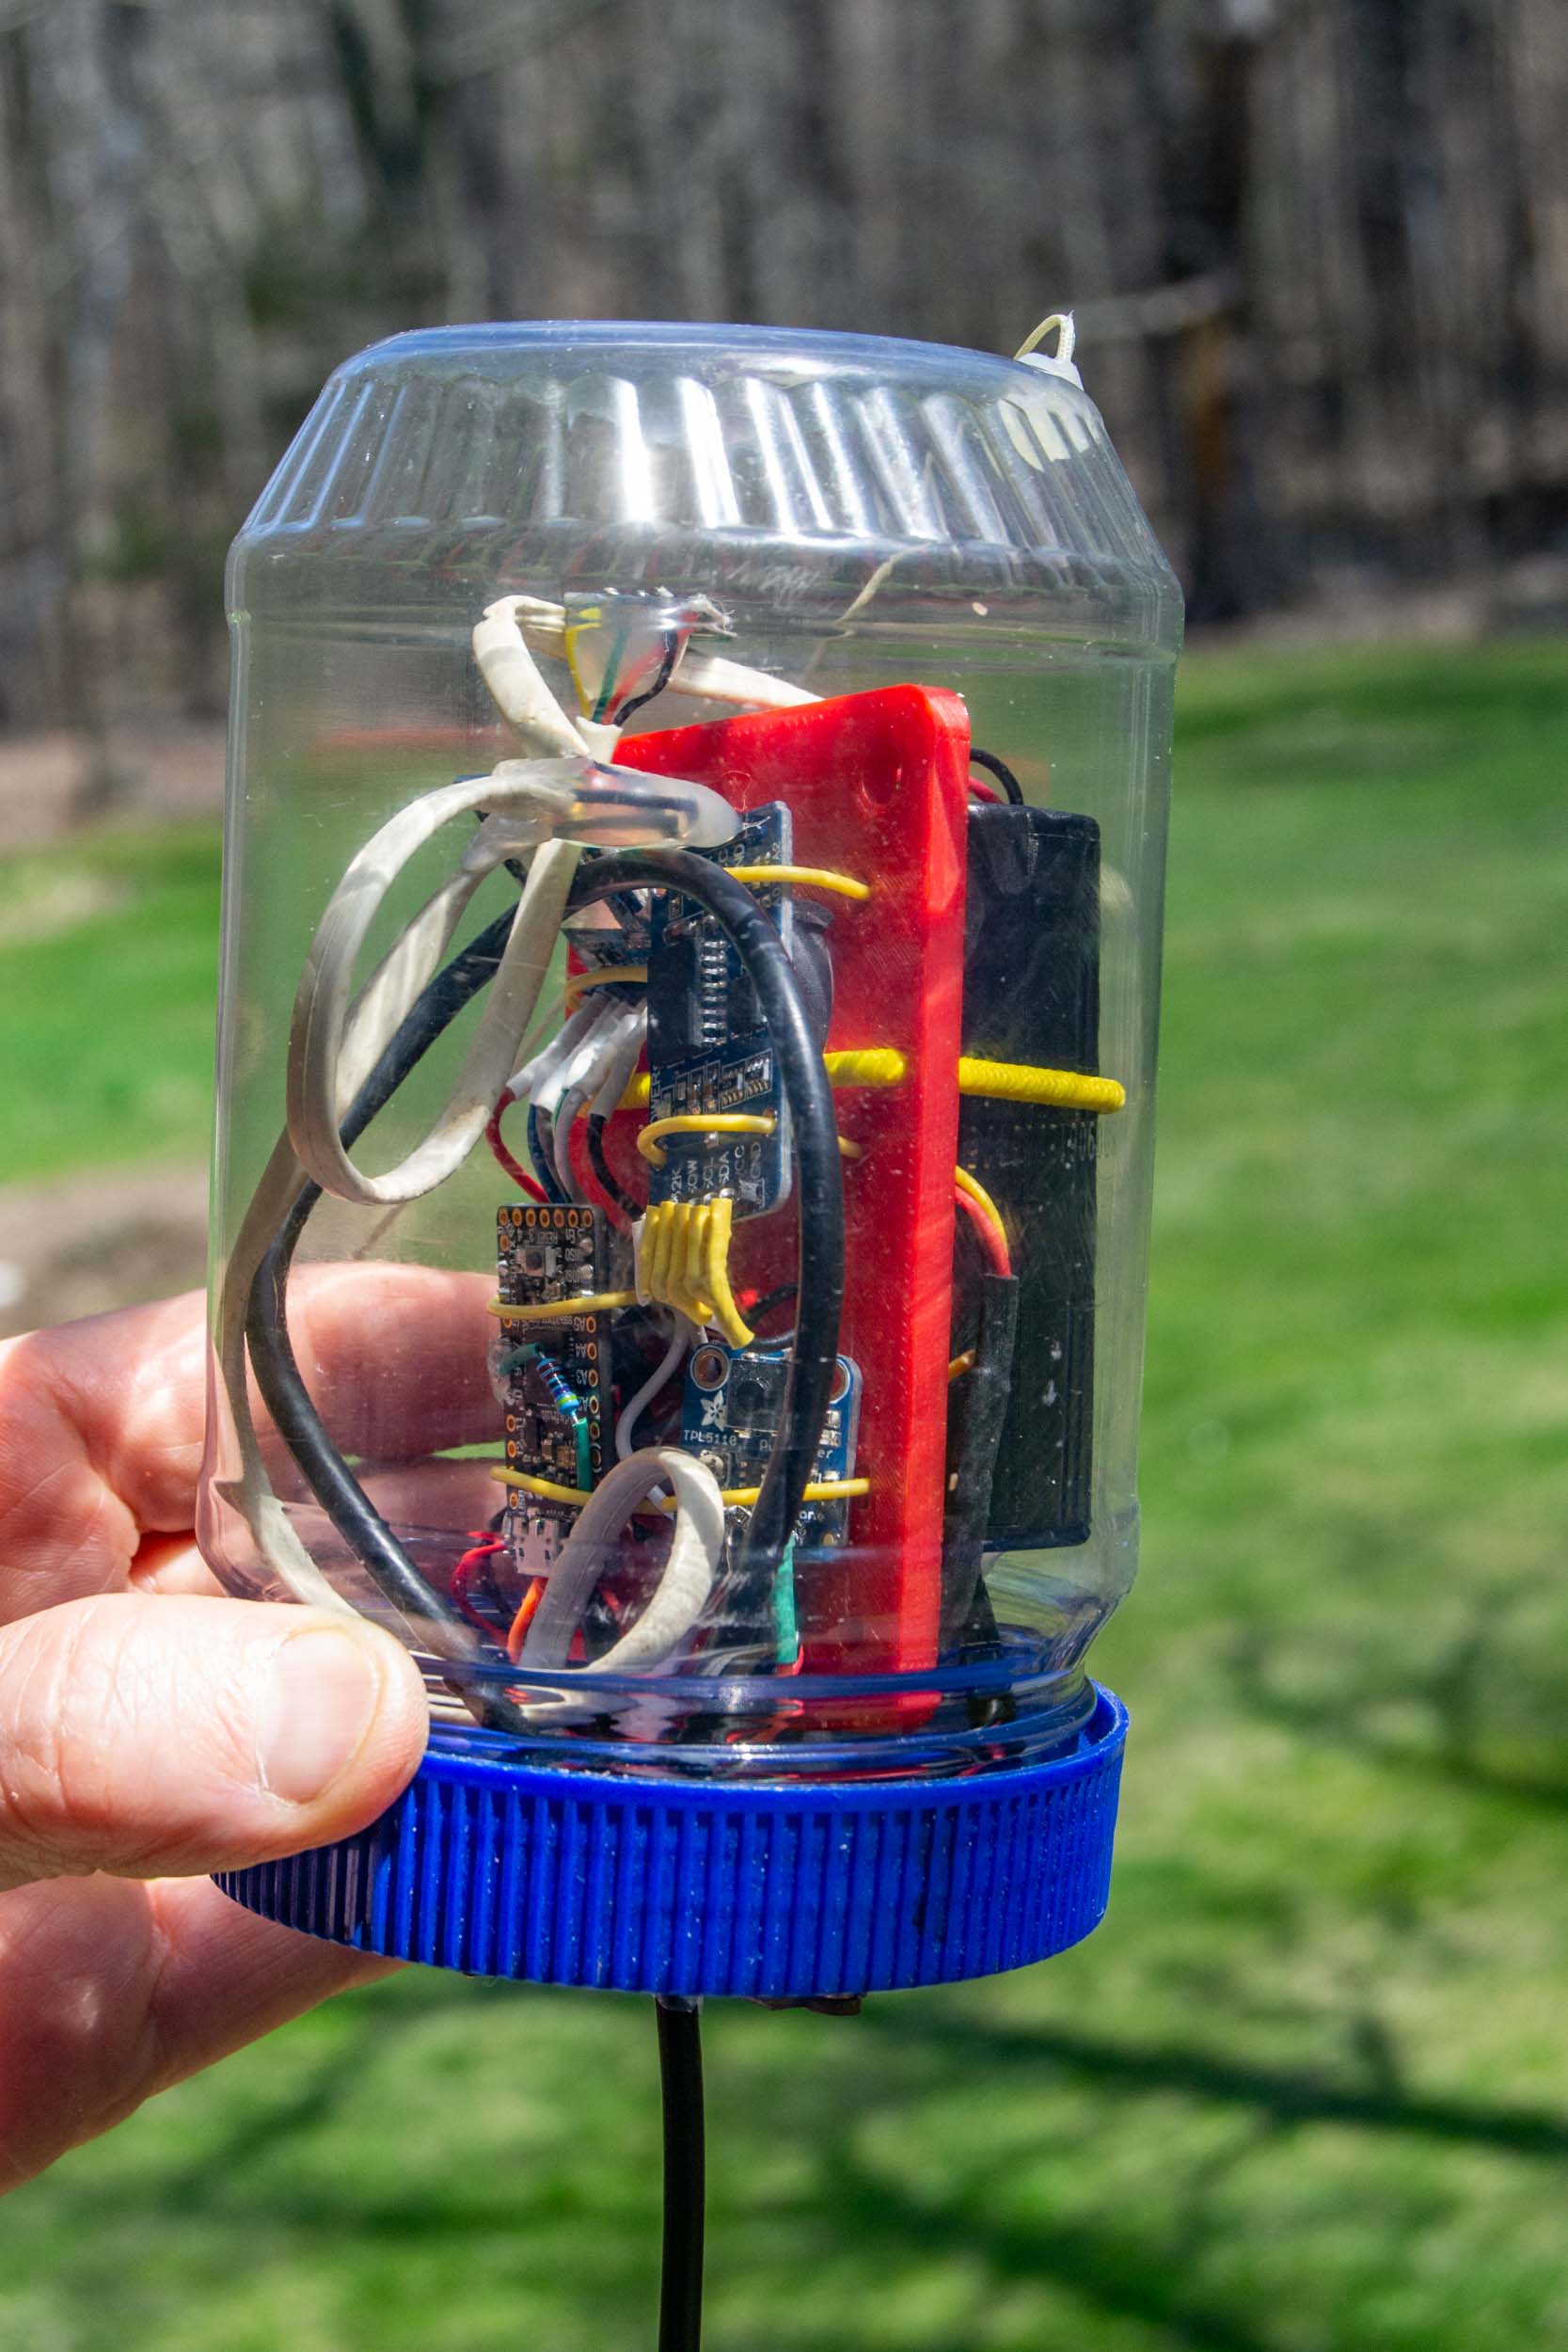
This is the Version 3 data logger. I installed this one on May 3 and also left the Version 2 logger in place. Two loggers are better than one, especially when you put the wrong batteries in them and one eventually stops working.
One possible success I had on May 3 was to deploy the third version of the data logger. This version was a test to see if I could reduce the cost of materials from about $50 to $35. It does the same thing as the first two loggers but is controlled by an Adafruit ItsyBitsy M0 Express instead of the Adafruit Feathers that I happened to have lying around the house. Having two loggers running side-by-side provides some information about the precision of a single logger, and also provides backup in case of (apparently highly probable) failure.
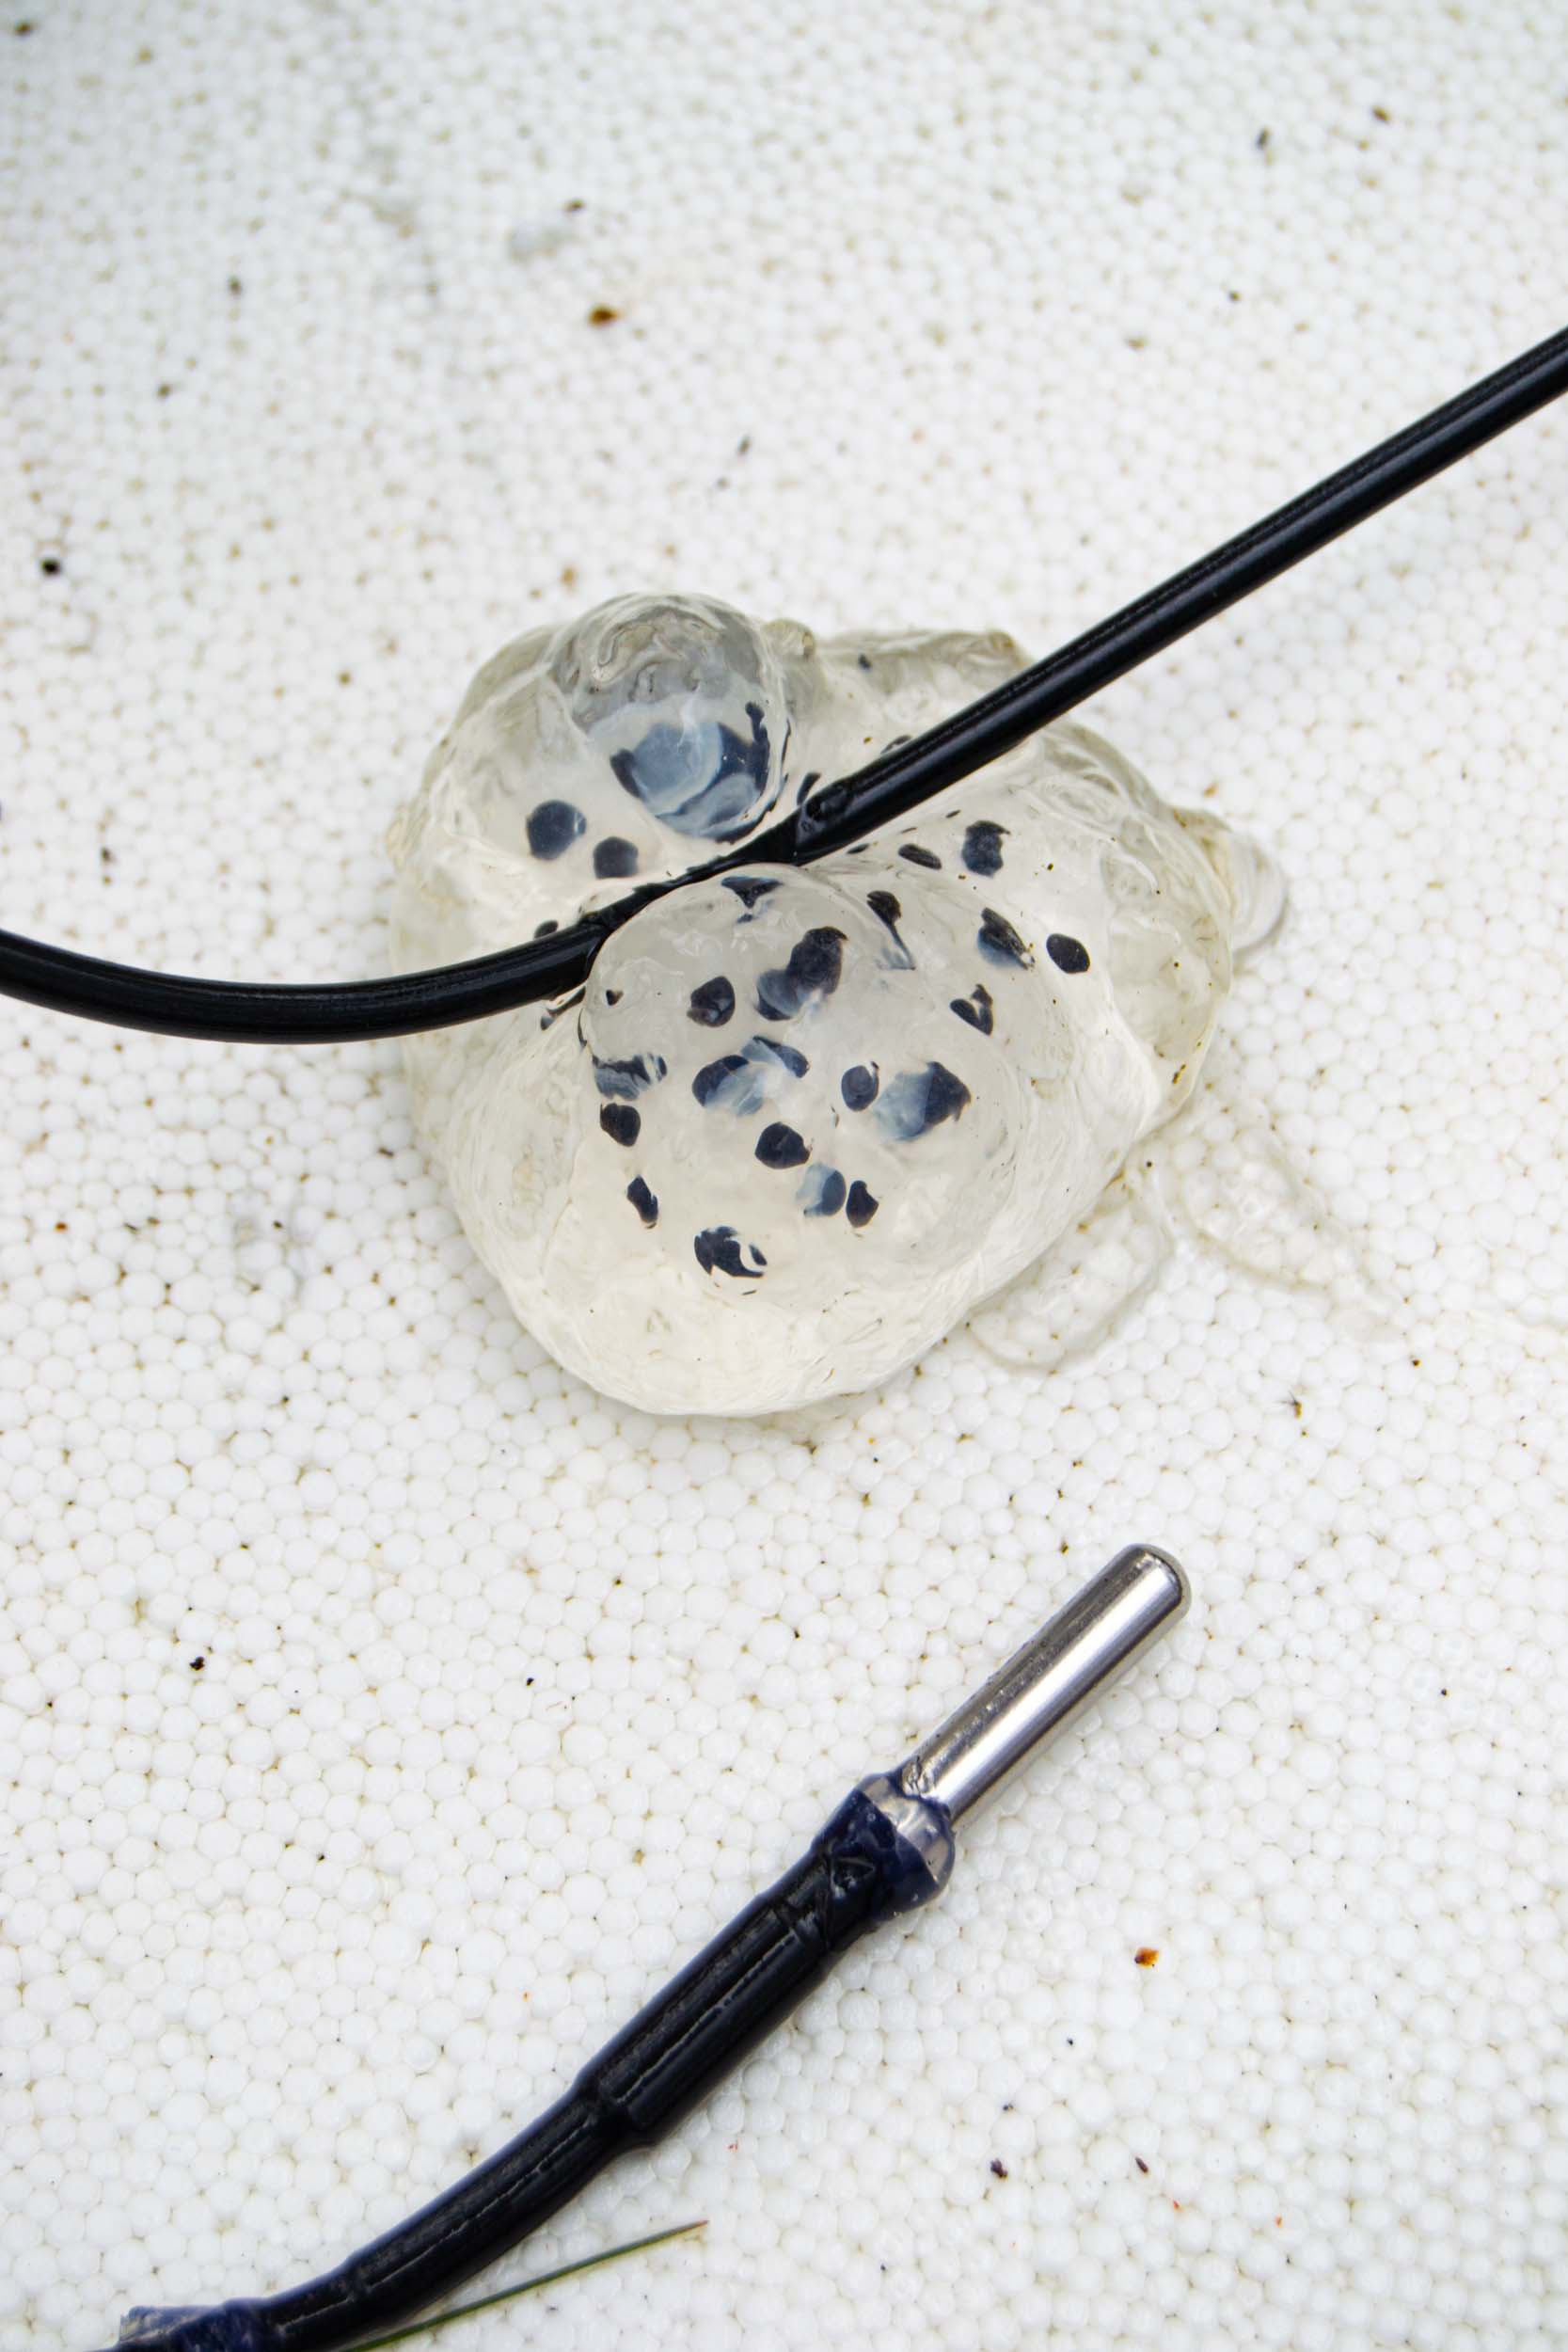
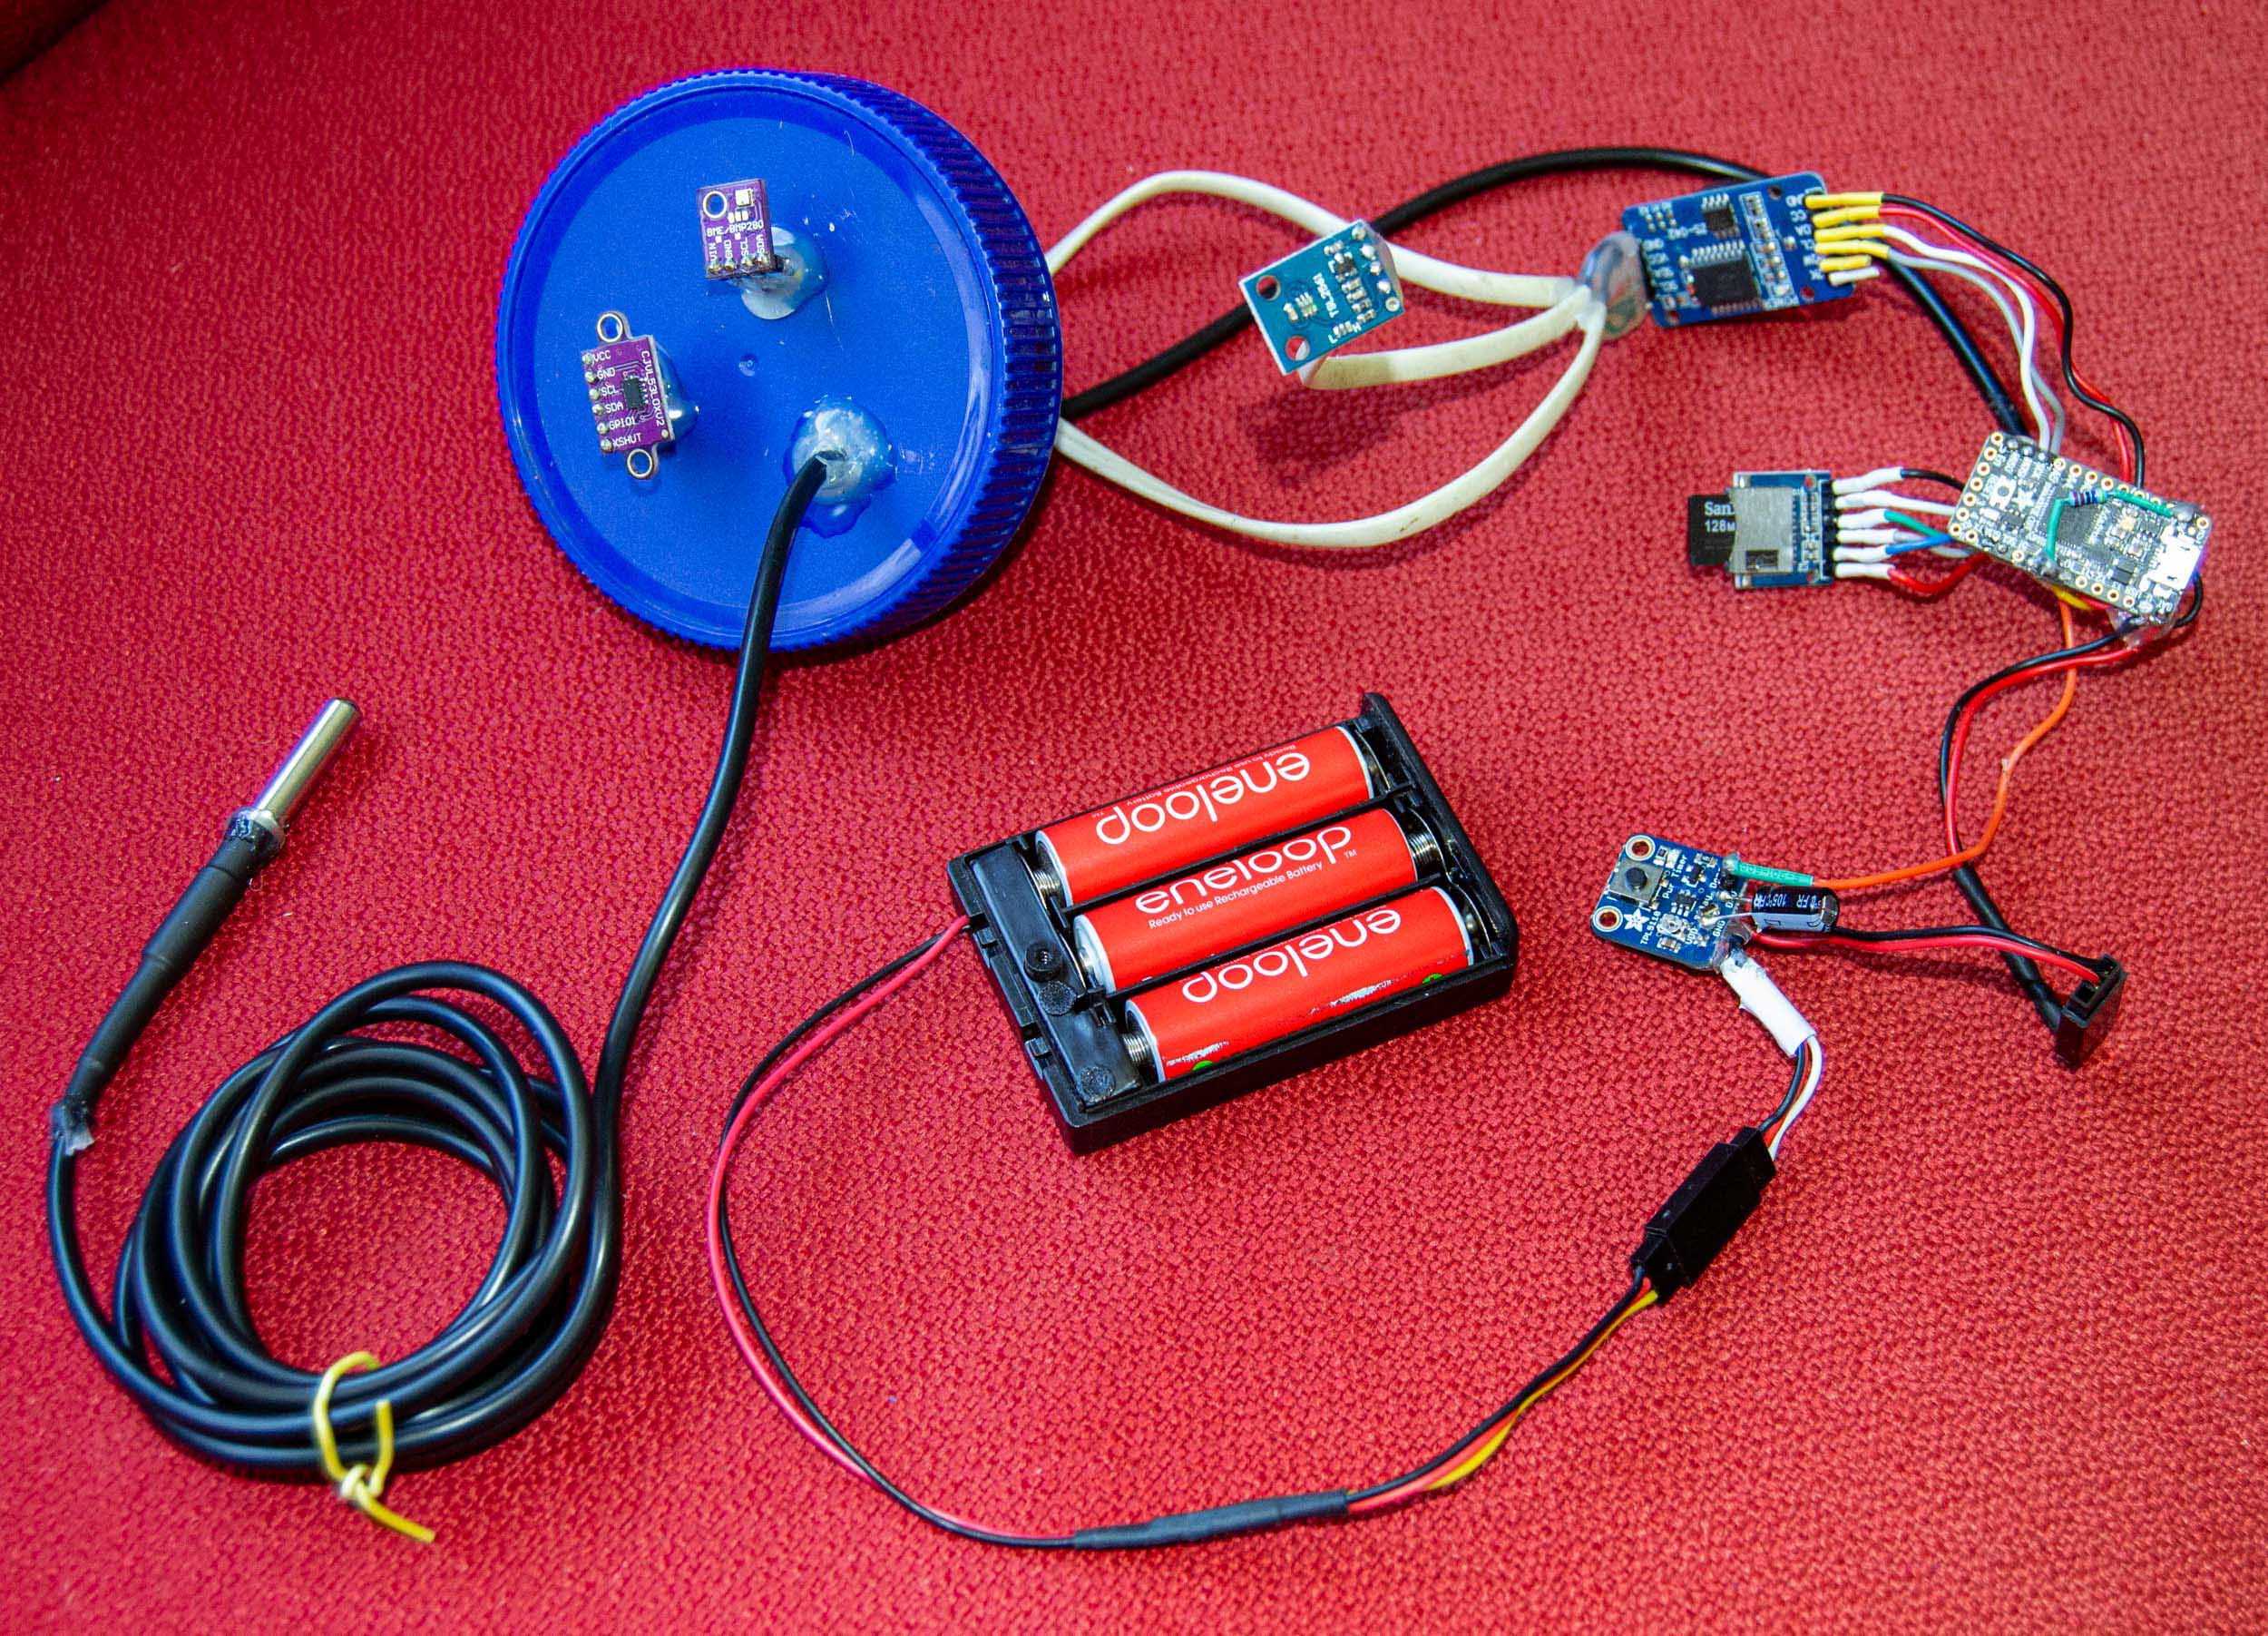
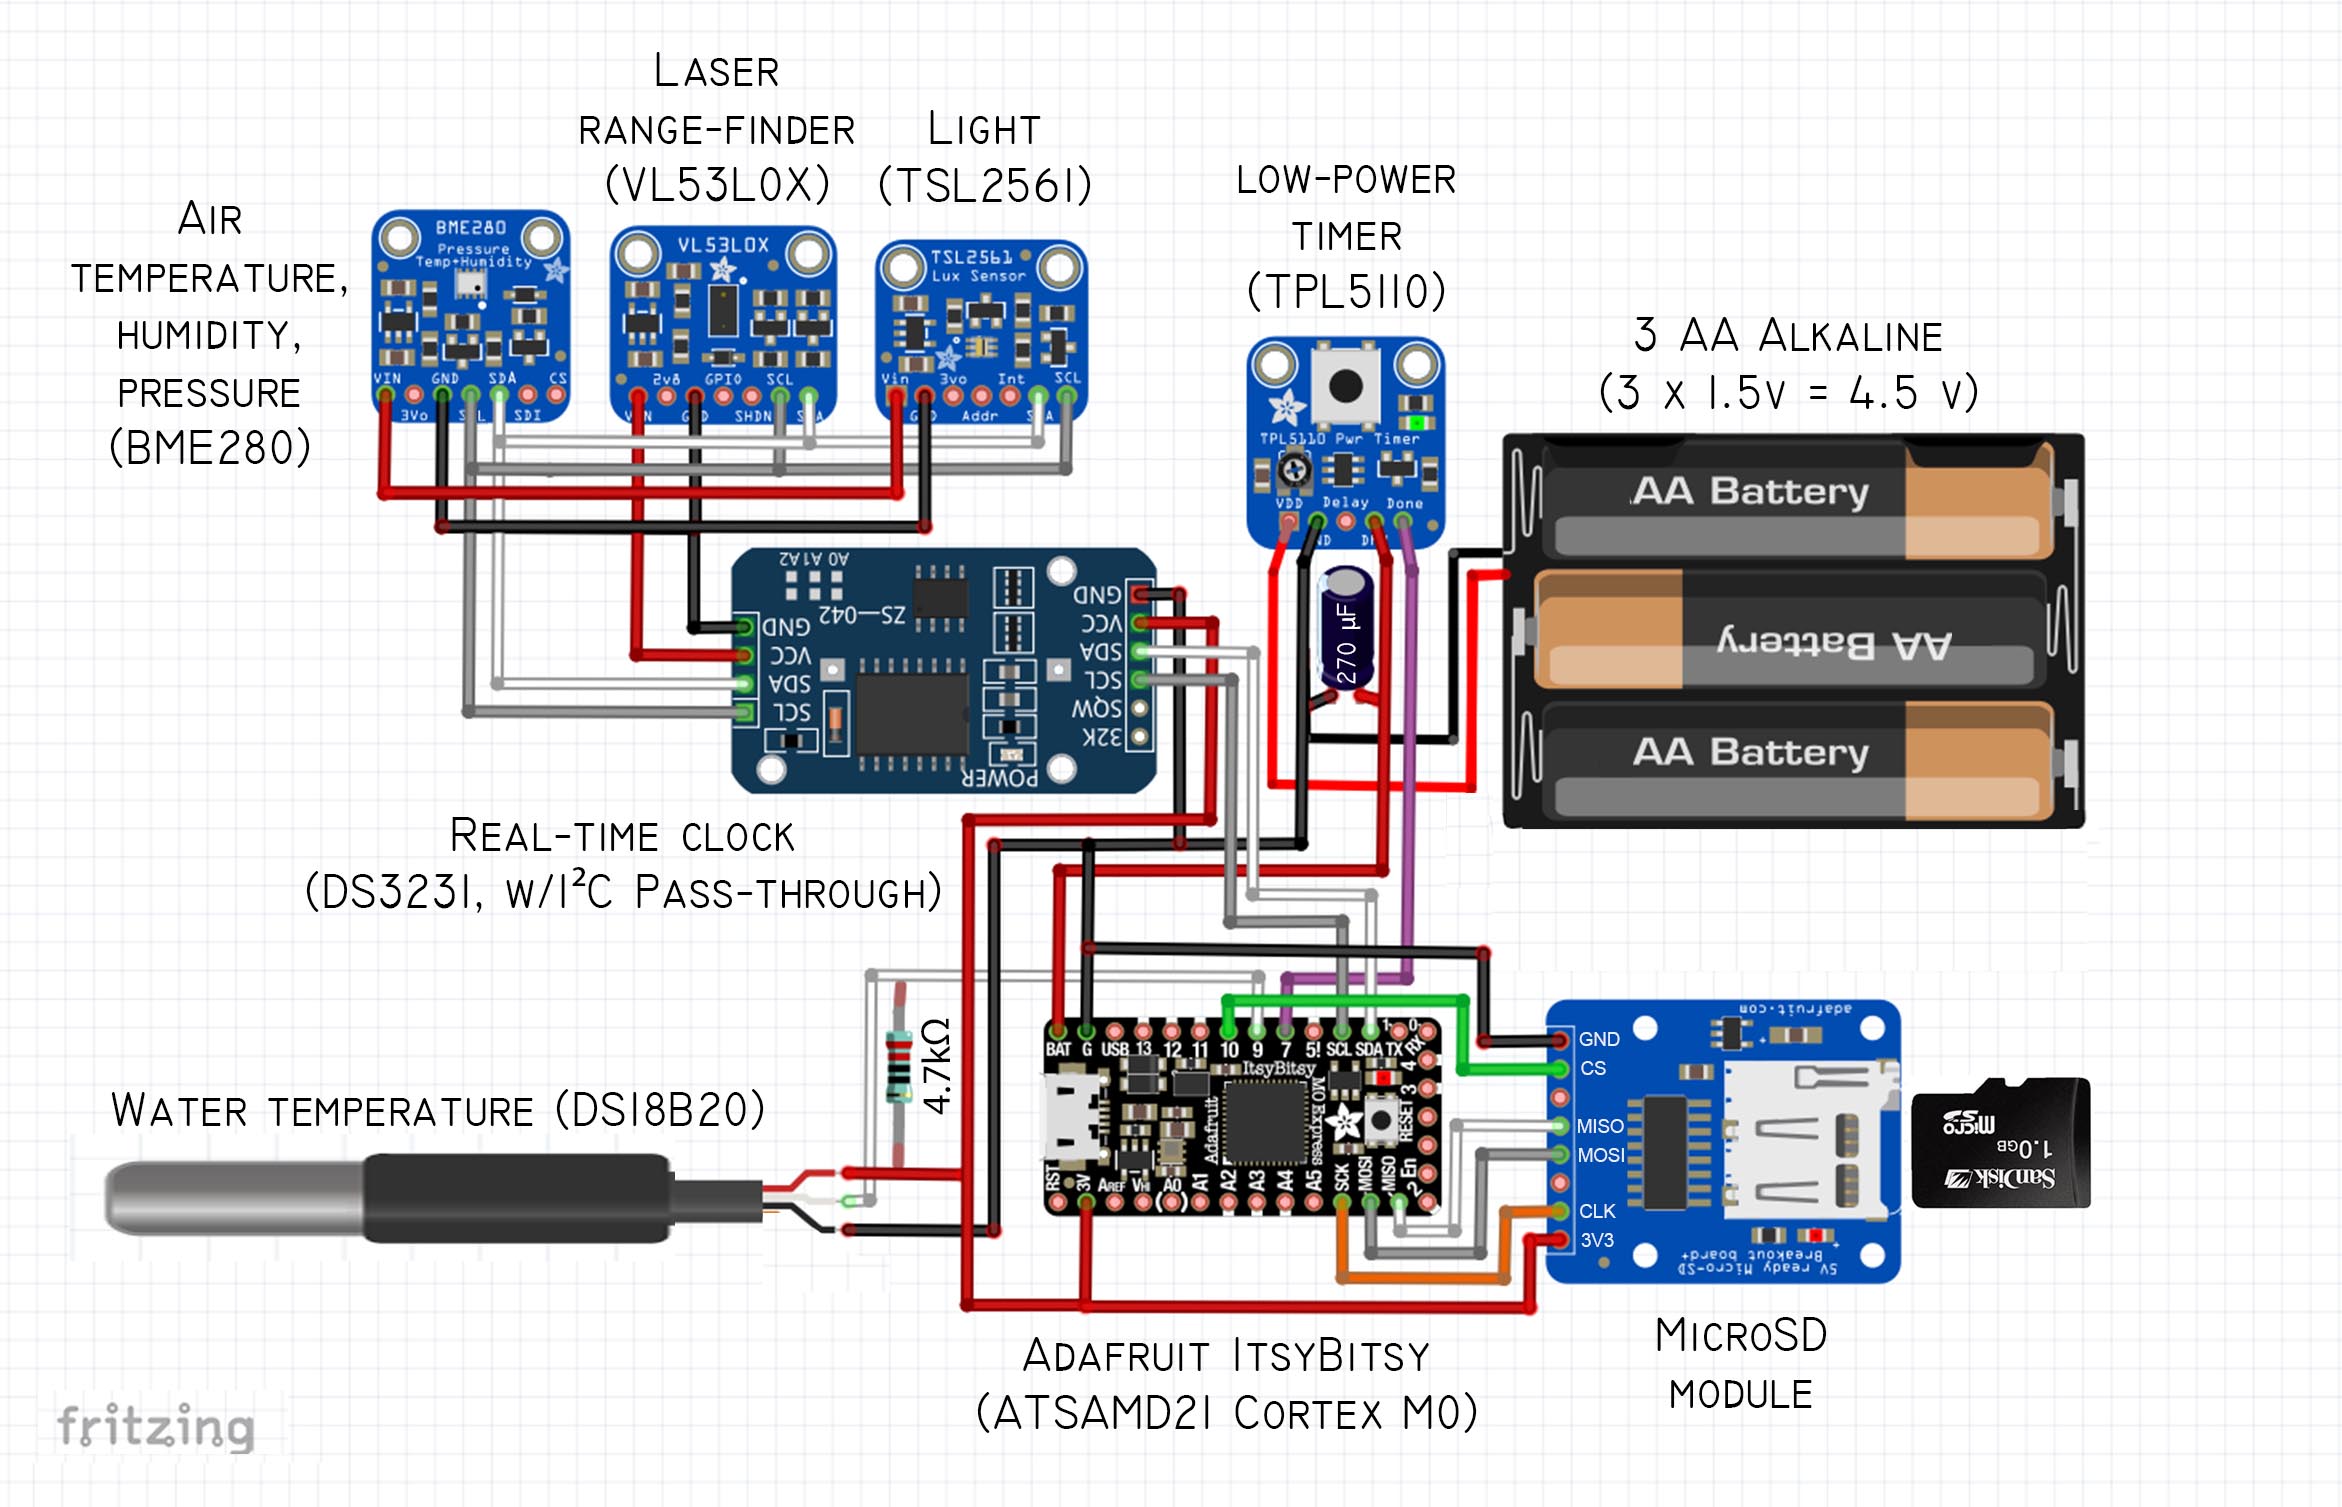
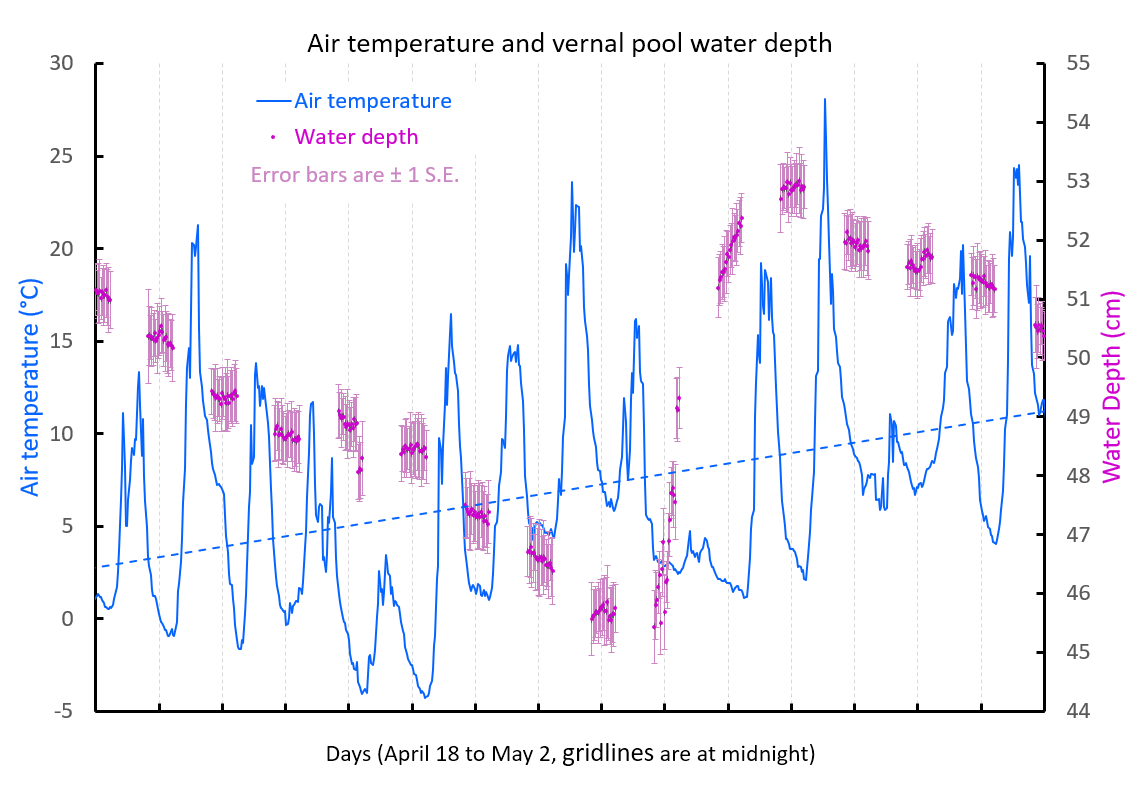
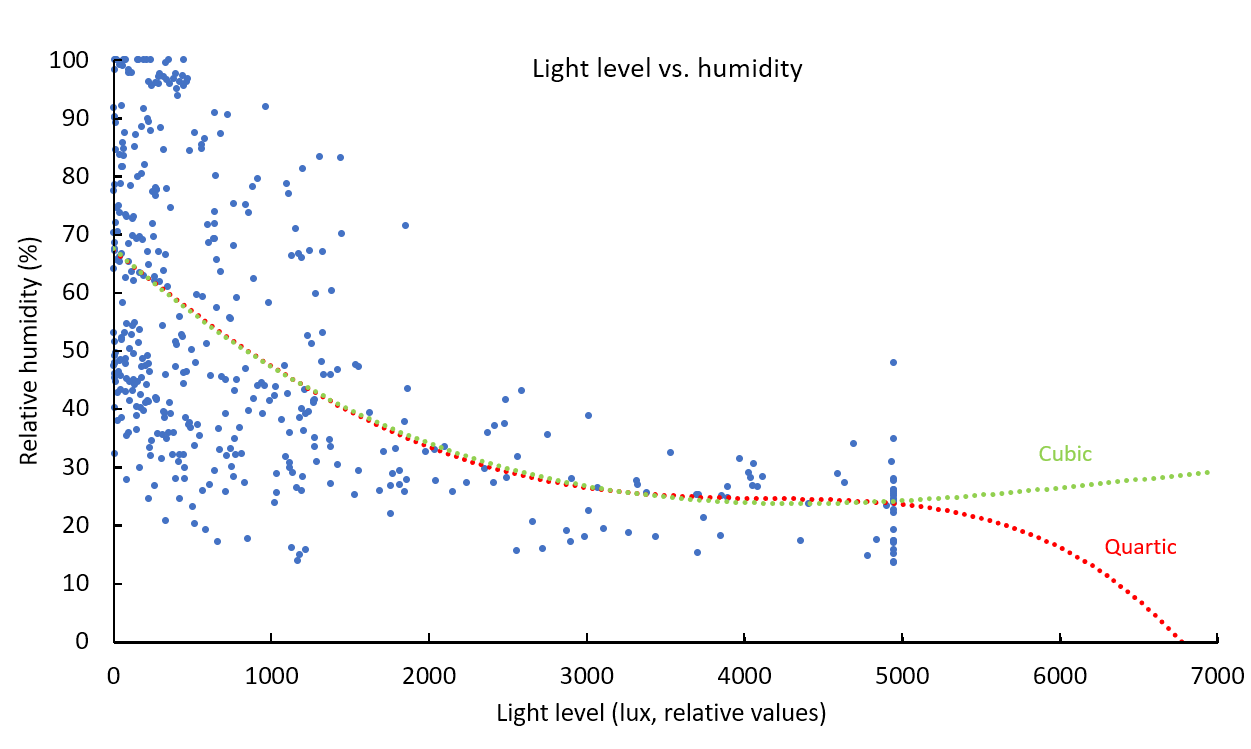
I returned to the vernal pool three days later (May 6) to replace the 1.2 volt batteries with 1.5 volt batteries in both loggers. In the three days since the Version 3 logger had been installed, spotted salamanders had attached egg masses to the new temperature sensor cable. May 6, 2020.The Adafruit ItsyBitsy M0 Express is a microcontroller board with the same processor (ATSamD21) as the Adafruit Feathers in the first two logger versions. The ItsyBitsy costs about half as much as a Feather. It is also eponymously smaller.These are the parts used in the Version 3 logger. You can buy everything here for about $35 if you shop carefully. There is a lot of soldering to do to connect everything, but that takes a lot less time than teaching yourself which connections need to be made.The Version 3 logger soldered together and ready to be stuffed into a peanut butter jar. A program is loaded onto the ItsyBitsy (far right). When power is supplied to the timer (lower right) the ItsyBitsy is turned on every 30 minutes. When the ItsyBitsy is finished reading the sensors and writing data to the microSD card, it sends a signal to the timer to cut power. Thirty minutes later the same thing happens, unless those red eneloop batteries no longer supply enough voltage, which is why they were replaced with alkaline batteries. Because nothing other than the timer is using power 99% of the time, the batteries will probably last for several months.All the components (not including sensors) were strapped to a plastic mounting board to keep them in place. The battery pack is on the other side. This fits inside a plastic 28 ounce peanut butter jar.Here is the circuit schematic for the Version 3 logger. There are more connections to solder in this version because the Feather and/or Featherwing in the earlier versions combined two components on one board. Two of the combined components (microSD module and real-time clock) cost less than $1.00 apiece as separate boards and contribute to the cost saving in this version. Click to embiggen.The dual loggers (Version 2 and Version 3) replicating each other’s efforts every 30 minutes. The Styrofoam float was extended so the new logger had something to bounce it’s laser off.Water depth and water temperature at the vernal pool (upper) and nearby rainfall data (lower, station KVTPIPER3) from March 29 through May 2, 2020. This combines data from the Version 1 logger (March 29 to April 17) with data from the Version 2 logger (April 17 to May 2). Increases in vernal pool water depth closely follow rainfall events at a weather station 3.8 miles away. The dashed blue line is a linear regression of water temperature to remind us that spring is happening. The primary migration of amphibians into the pool was probably on April 13 (frog) when the first warm rain of the season occurred. Our observations indicate that spotted salamander eggs were deposited before April 17, between April 17 and May 3, and between May 3 and May 6. Click to embiggen.A new feature of the Version 2 logger was the computation of standard deviation of the laser rangefinder measurements. Every 30 minutes, 20 measurements are taken down to the Styrofoam float (during a few seconds). The ItsyBitsy microcontroller computes the mean and standard deviation and saves those two values. The error bars above are the standard errors calculated from the standard deviations. The error is relatively small and is highly constant suggesting that the precision of the laser rangefinder is both acceptable and predictable, at least in this part of its measurement range. The dashed blue line is a linear regression of air temperature to remind us that spring is happening. Data are from the Version 2 logger only. Click to embiggen. Scatterplot of the relationship between light level (from the TSL2561 sensor) and relative humidity (from the BME280 sensor). When it is very bright over the vernal pool (2000-5000 lux) the relative humidity is always below 50% (so you can sort of predict humidity from light level). When it is not bright (0-2000 lux) the humidity can be just about anything (so you can’t predict humidity from light level). The dotted lines are fitted polynomials (green is third order [cubic] and red is fourth order [quartic]). These both follow the data well and characterize the general trend. I extended the fitted curves beyond the data (from 5000-7000 lux) to honor Kevin Hassett, the Chairman of the White House Council of Economic Advisors, who used a cubic polynomial (probably in Excel, just like I did) to propagandize that the daily death toll from COVID-19 would be zero before the end of May. There is little information in the above dataset to suggest whether humidity would be higher or lower if light level were 7000, but if you wanted to convince your boss that you were a sycophant and you knew as little about math as he did, you could keep fitting curves until you found one he liked, and then tweet it. Click to embiggen.
So the first failure of the day, caused by insufficient voltage in the data logger, did not result in as much data loss as I had feared. The second failure also happened because of low battery voltage when I tried to photograph the pool with a camera at the top of a 24 foot pole. The pan-tilt rig which was pointing and shooting the camera needed higher voltage to prevent brownout and resetting of the microcontroller (yeah, they are everywhere). On May 6 when I returned to replace the batteries in the data loggers, I had better batteries in the pan-tilt rig and overcame that failure too (stay tuned for the stitched aerial panorama)[here it is].
The third failure might stay with me for a while — I still have never seen a fairy shrimp.
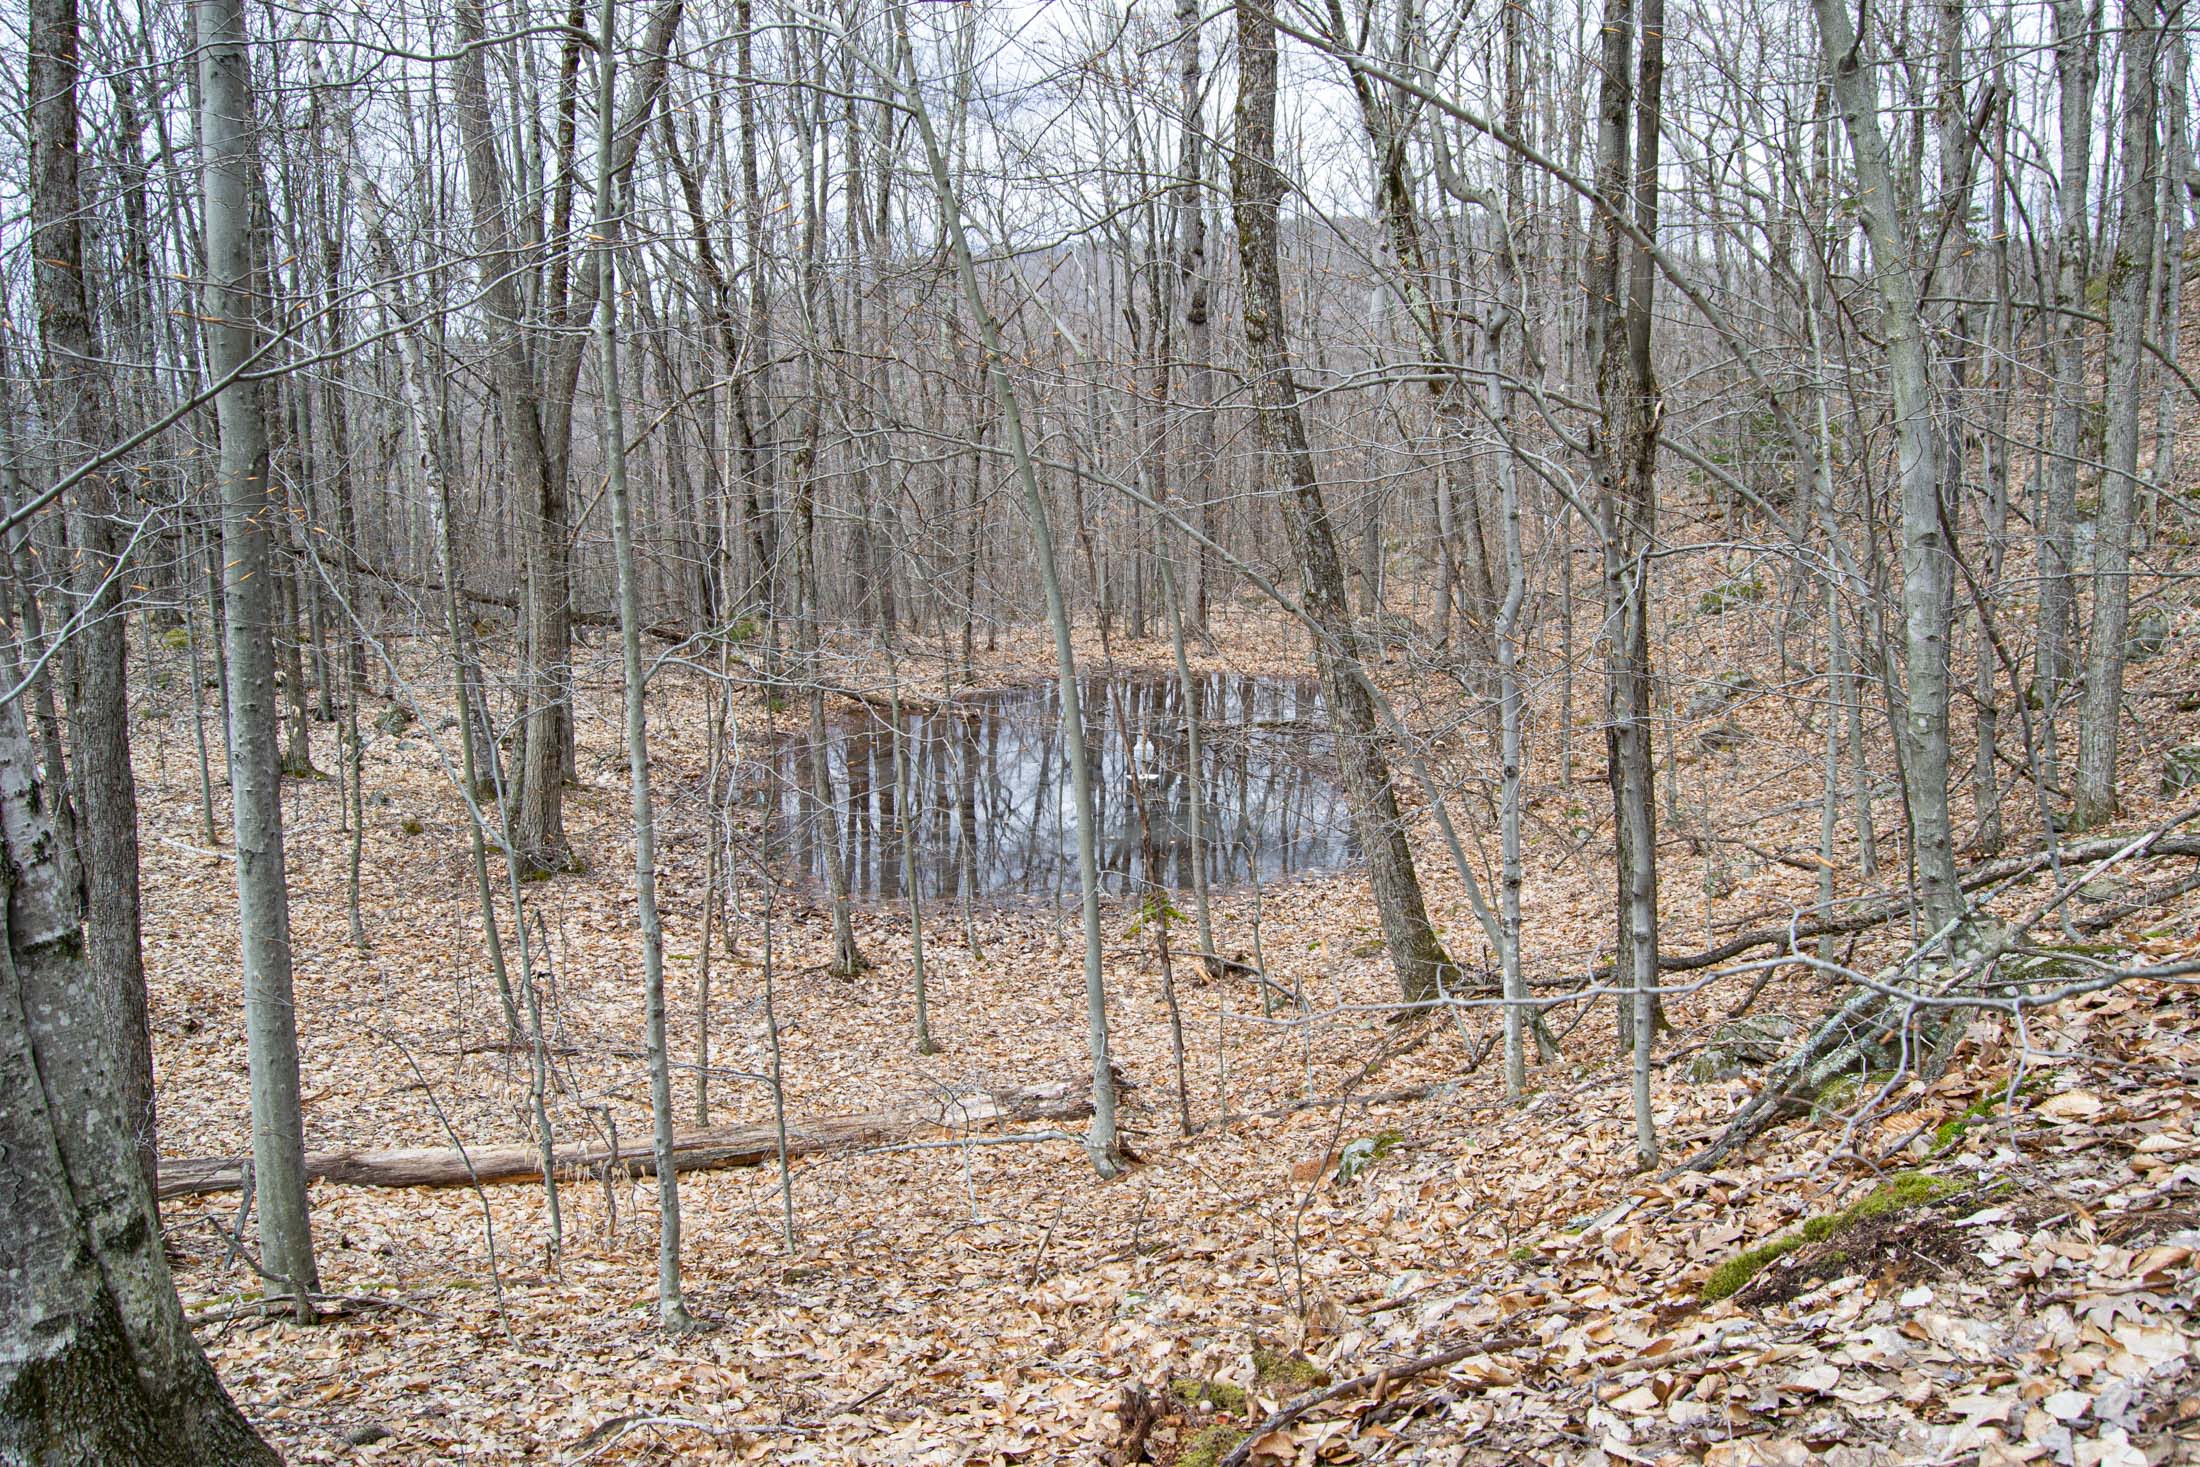
This was my last view of the vernal pool as I left on May 6, and probably the last time I will see it before the scene is very green.
The Arduino sketch running on the ItsyBitsy is here.