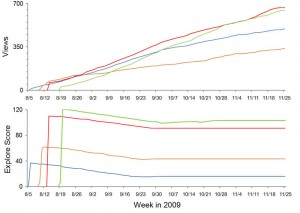
I have been collecting data about the gigapans I upload to gigapan.org ever since I noticed some unexplained behavior in the View counts and Explore Scores of my first public gigapans. Unlike YouTube, Gigapan does not make archival user data publicly available, so it has to be independently collected. Kilgore661 has been doing a great public service by collecting these data for all gigapans for about three years, and you can explore his archive here and use his nifty graphing tools. I have more than a year’s worth of slightly denser data on my own gigapans. Graphs of these data are wildly revealing about the nature of Explore Scores and the inherent differences among gigapans in how they accumulate Views. I hope to show some of these results at the Fine Outreach for Science Workshop in November.

Unlike Kilgore661, I wasn’t smart enough to use the gigapan API to automate this process, so I have been screen scraping and I just had to stop. The gigapan API is essentially undocumented, but thanks to Miriam at gigapan and Will at Fastie Systems, I now have a tool that collects the pertinent data on all of my gigapans and makes it easy to paste it into Excel. You can see the tool in action here, and learn how to install it on a Web page to fetch the information about your own gigapans.
Skip to content
At the end, I am at home in the woods
