Vernal pools are little ponds which have no permanent stream entering or exiting. They fill with snowmelt, rain, and groundwater, but in droughty years they often dry out before summer’s end. These characteristics prevent fish from living in vernal pools (fish can’t get to them and fish couldn’t escape when they dry out). This allows animals with little defense against hungry fish to prosper in vernal pools, especially if they can also survive when the pool dries out.
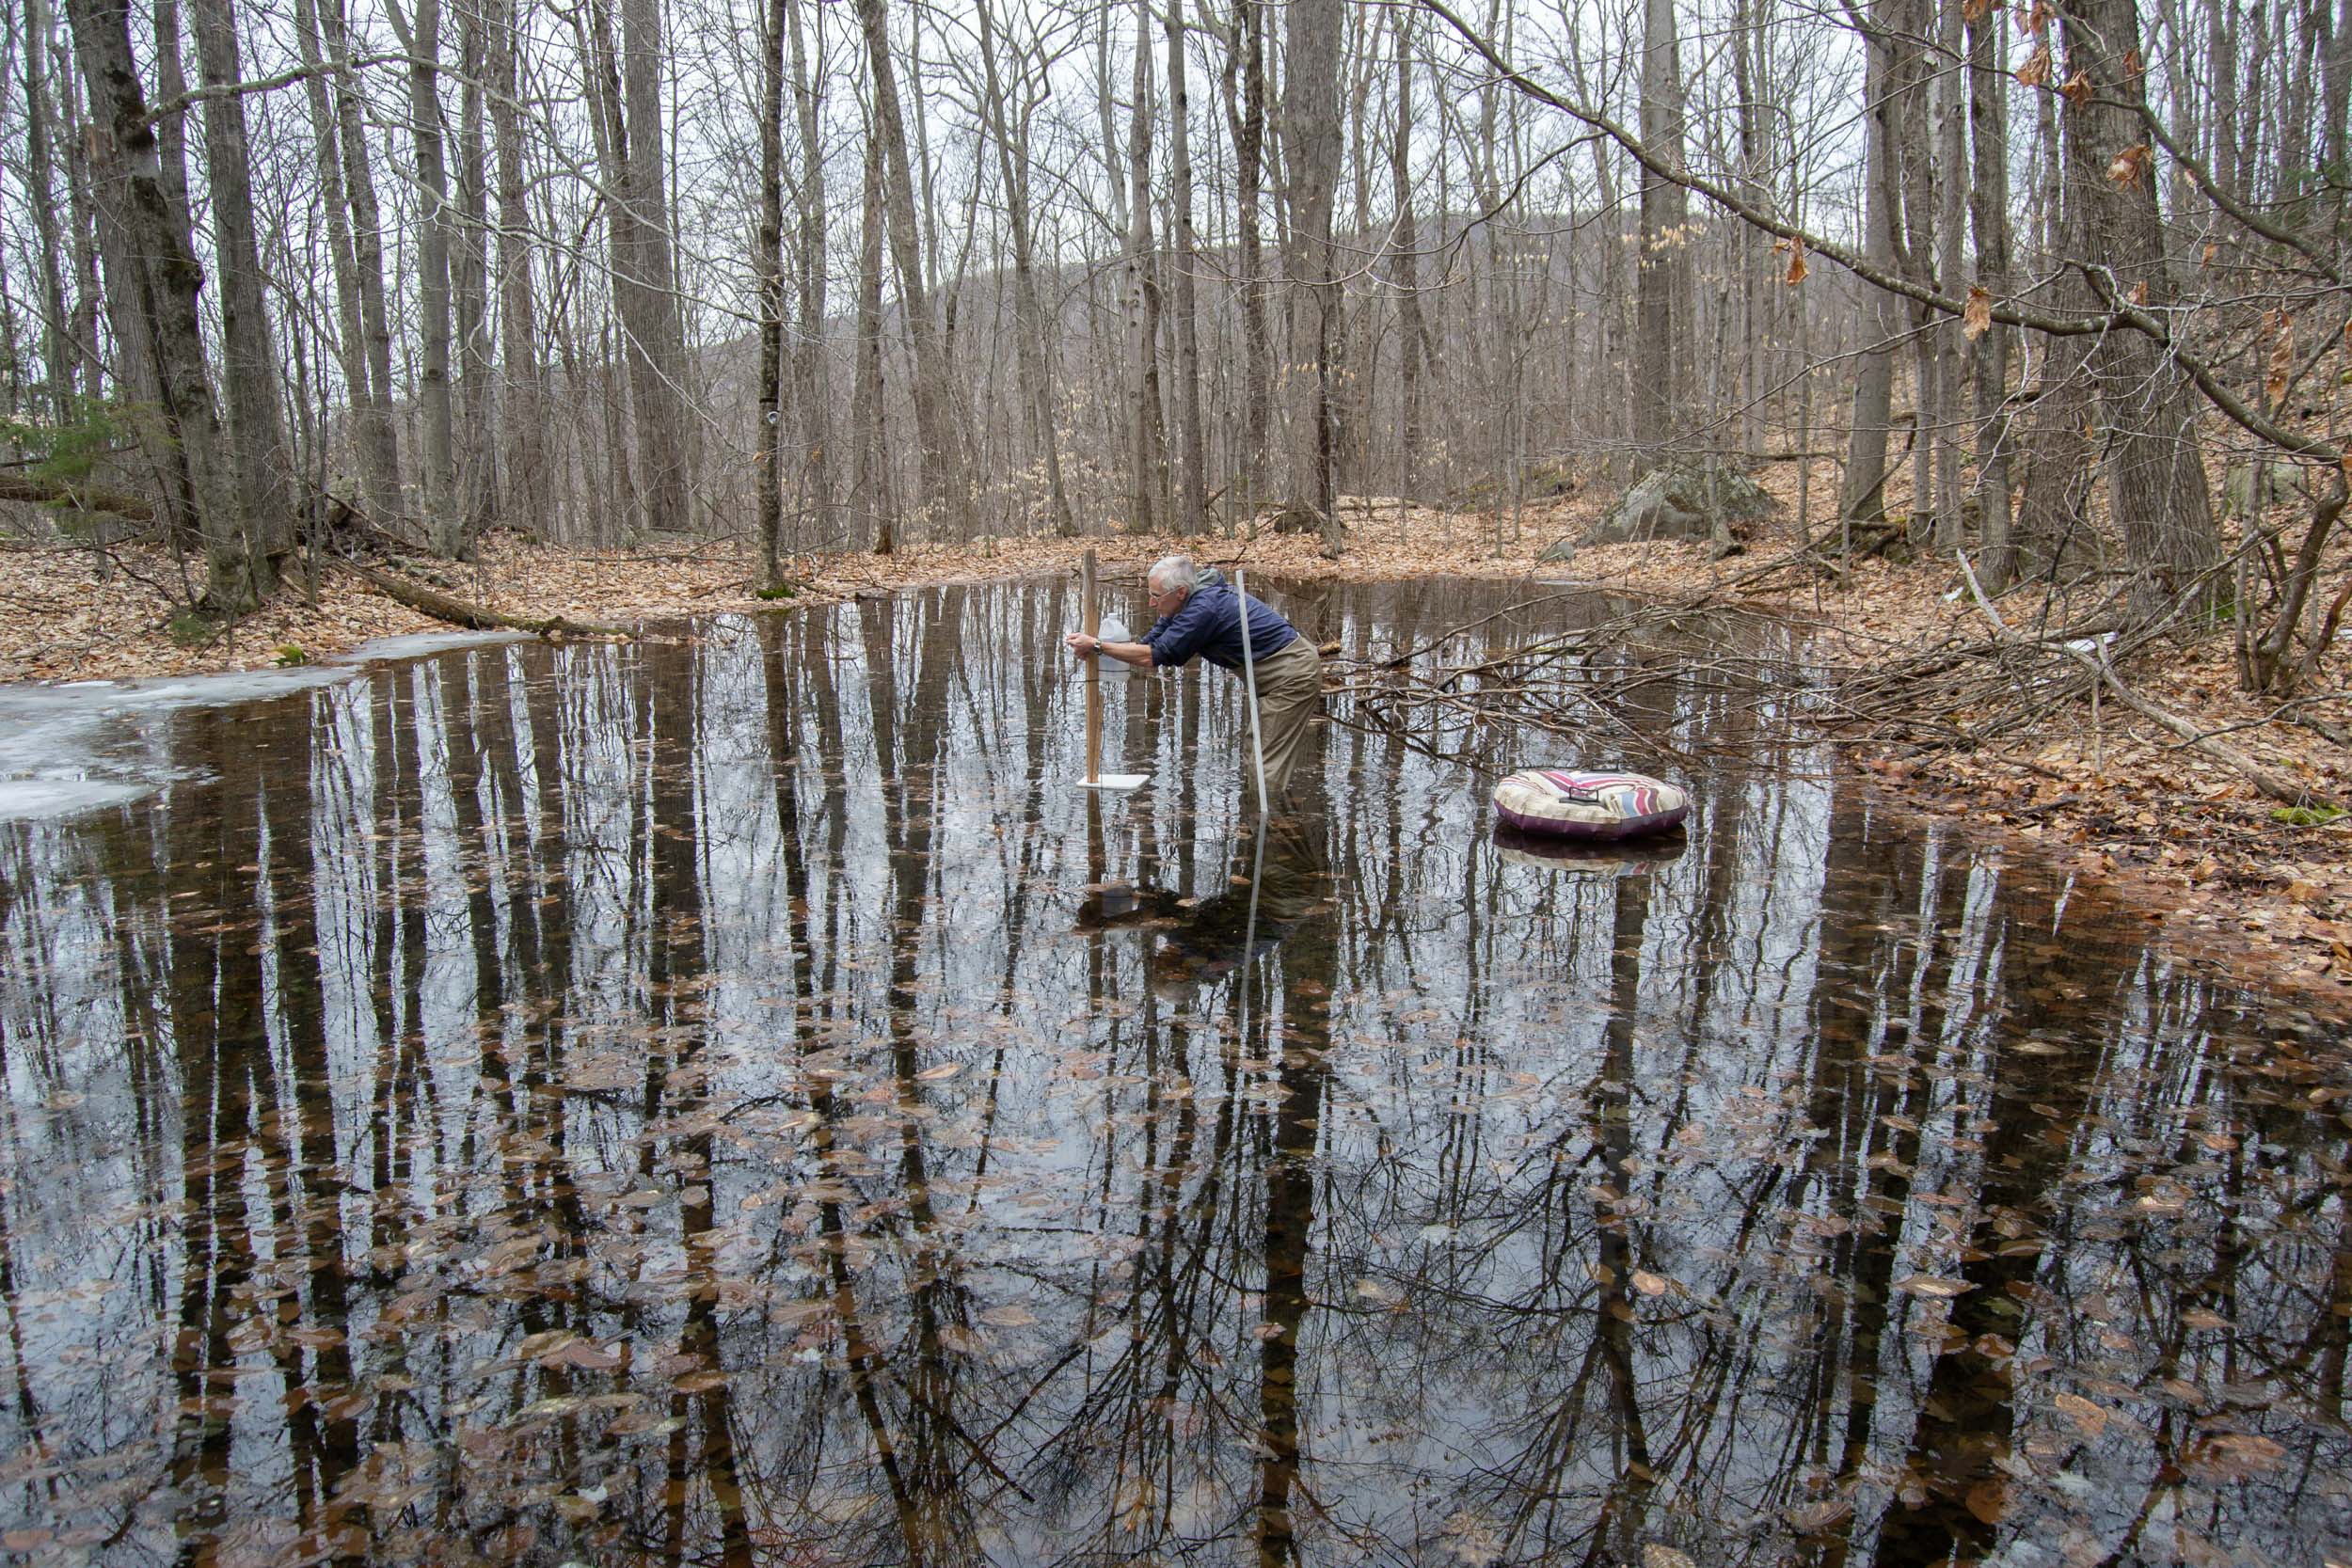
Amphibians are excellent candidates to thrive in vernal pools because their poorly defended larvae (e.g., tadpoles) do better where there are no fish, and if the pool dries up they can just walk (or hop) away.
Some strange aquatic invertebrates are common in vernal pools. Fairy shrimp (in the same order as brine shrimp) are tiny crustaceans which can survive for years as cysts and appear again when conditions are good. Fingernail clams are often found in vernal pools and survive droughts by burrowing into the bottom sediments.
In 2008, the Vermont Center for Ecostudies began to map vernal pools in Vermont. In 2018, they started the Vernal Pool Monitoring Project to learn more about some of these pools. Volunteers “adopt” a vernal pool and make several visits each year to document the physical characteristics and presence of amphibians and key invertebrates. To determine if and when each pool dries out, a temperature logger (HOBO Pendant® MX Water Temperature Data Logger) is installed on the pool bottom. If the pond dries up and exposes the logger to the air, the change in temperature will document the approximate date.

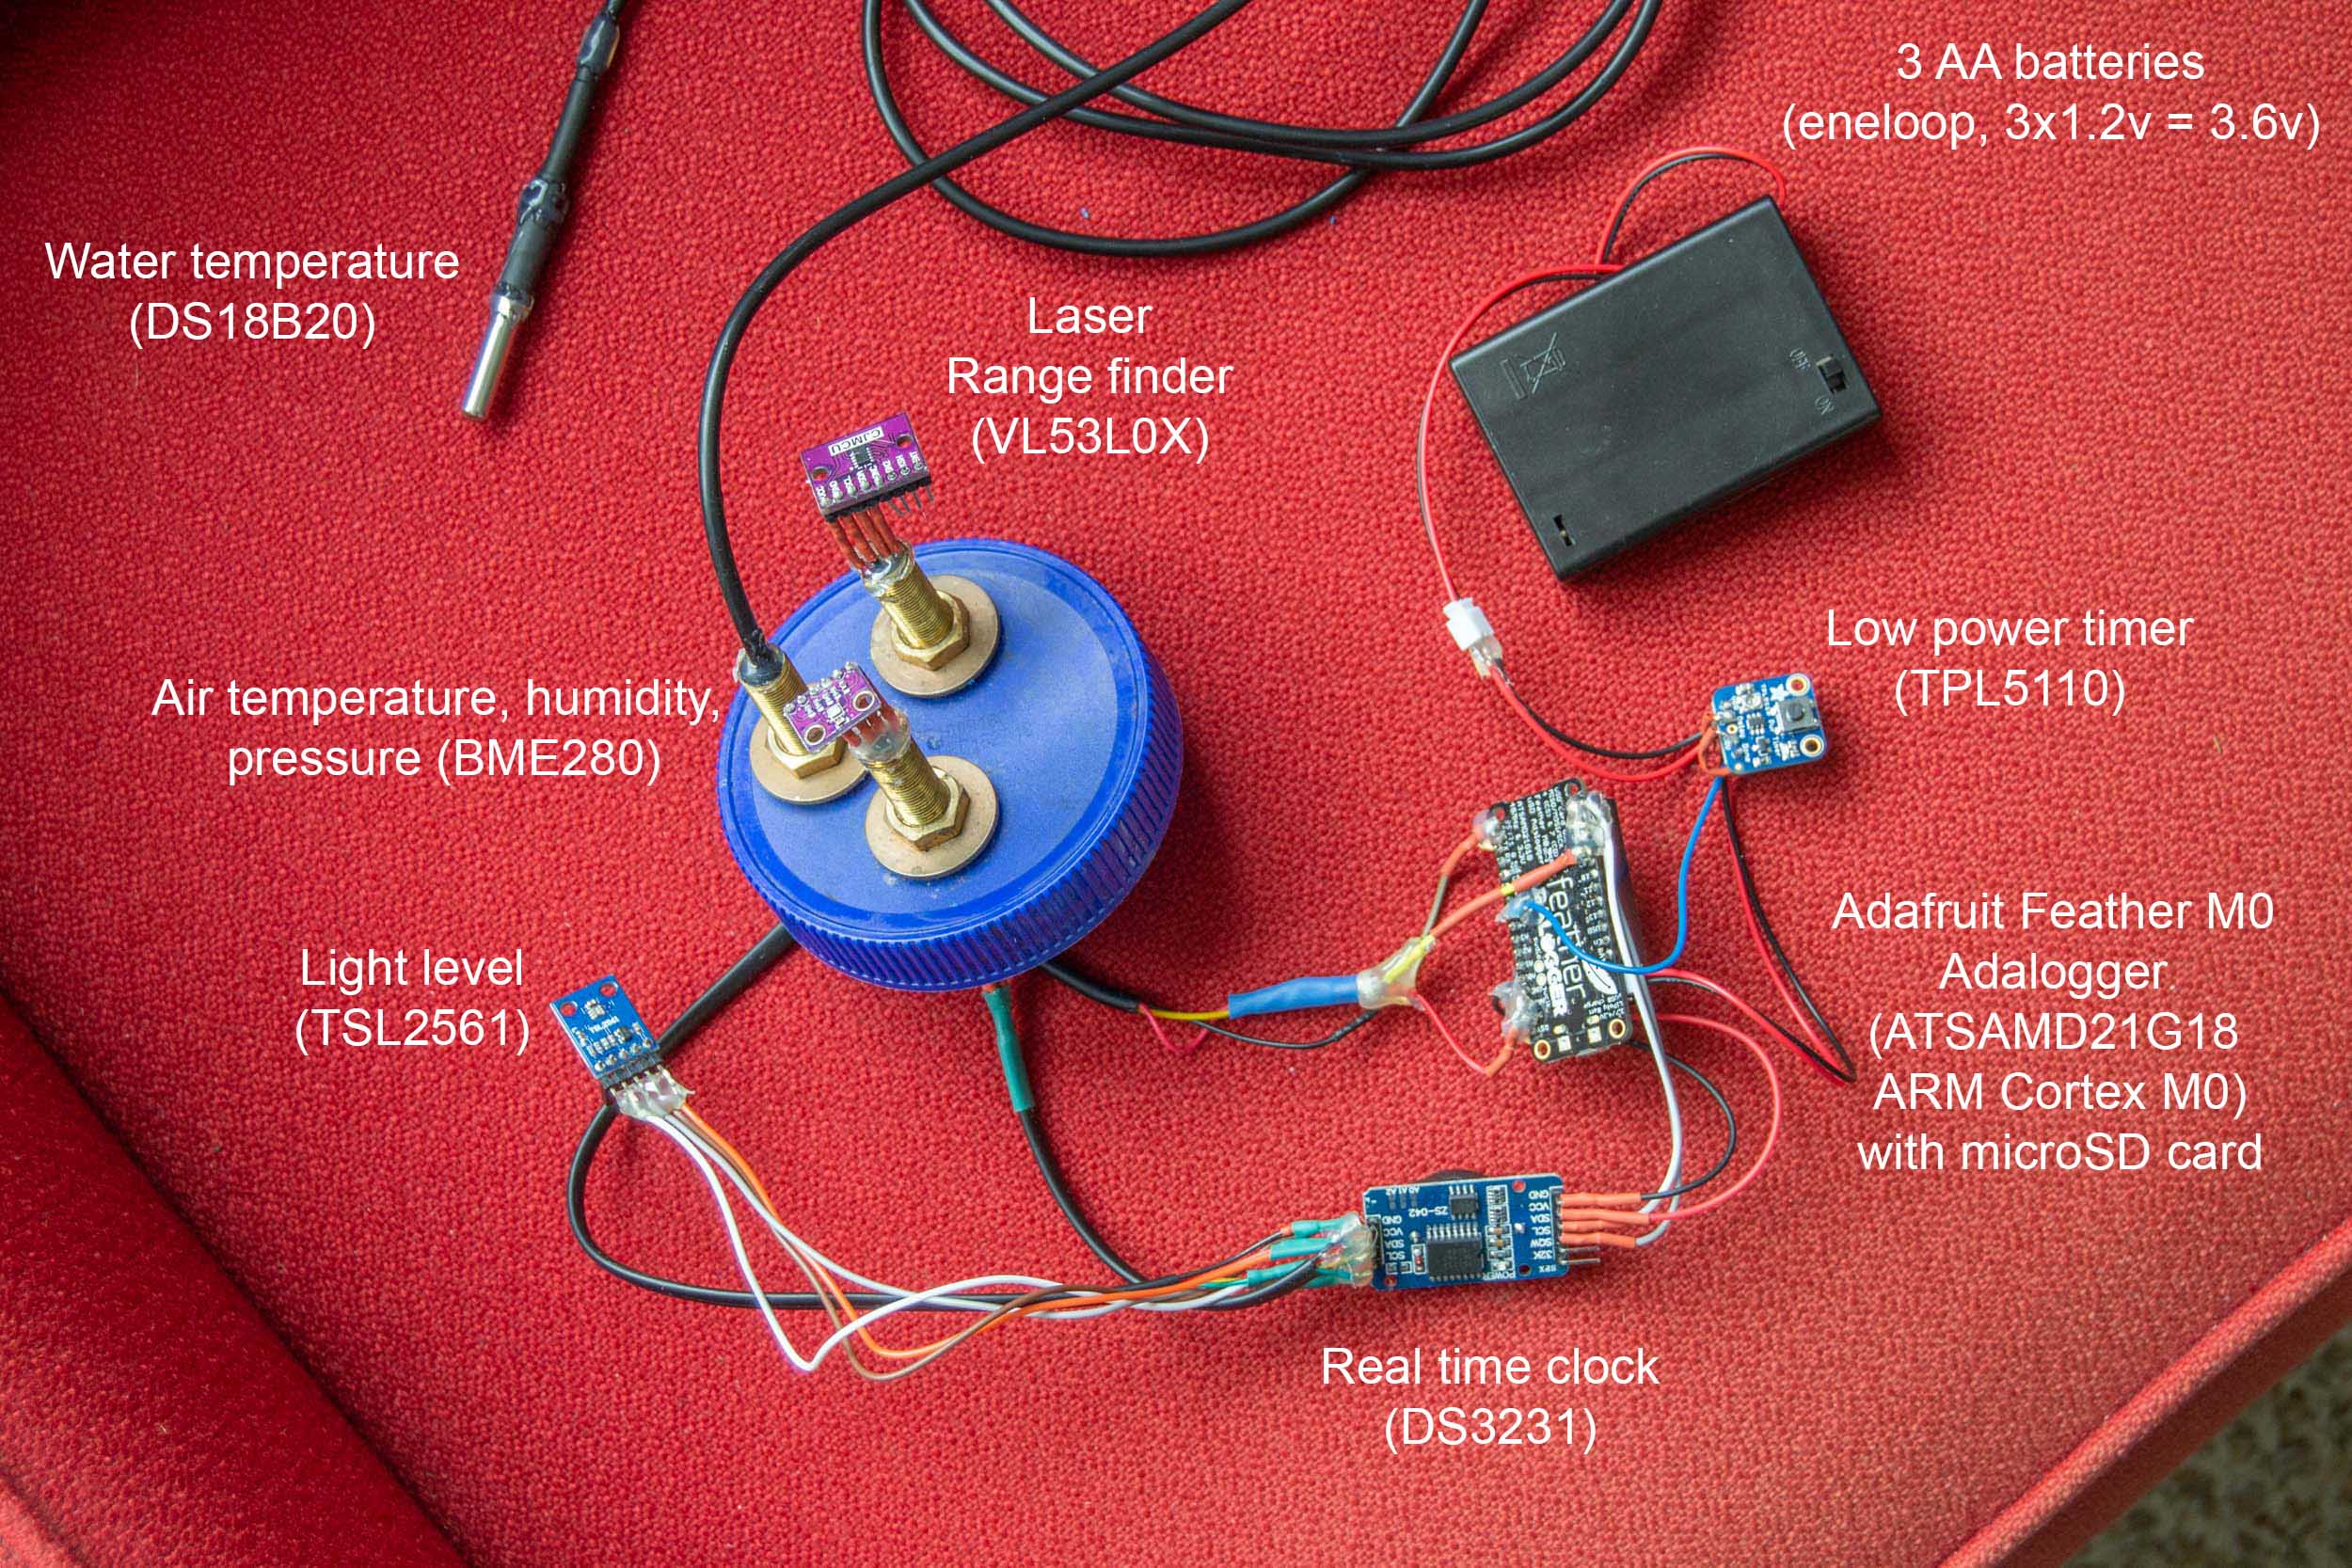
This spring I joined the team assigned to a nearby vernal pool in the Green Mountain National Forest near Middlebury. When I learned about the temperature logger, I thought it might be useful to expand the data collecting. I built a data logger that records water temperature, air temperature, humidity, barometric pressure, light level, and water depth. I had previously used all of the sensors and other hardware required, but making them all work together for this purpose was harder than I expected.
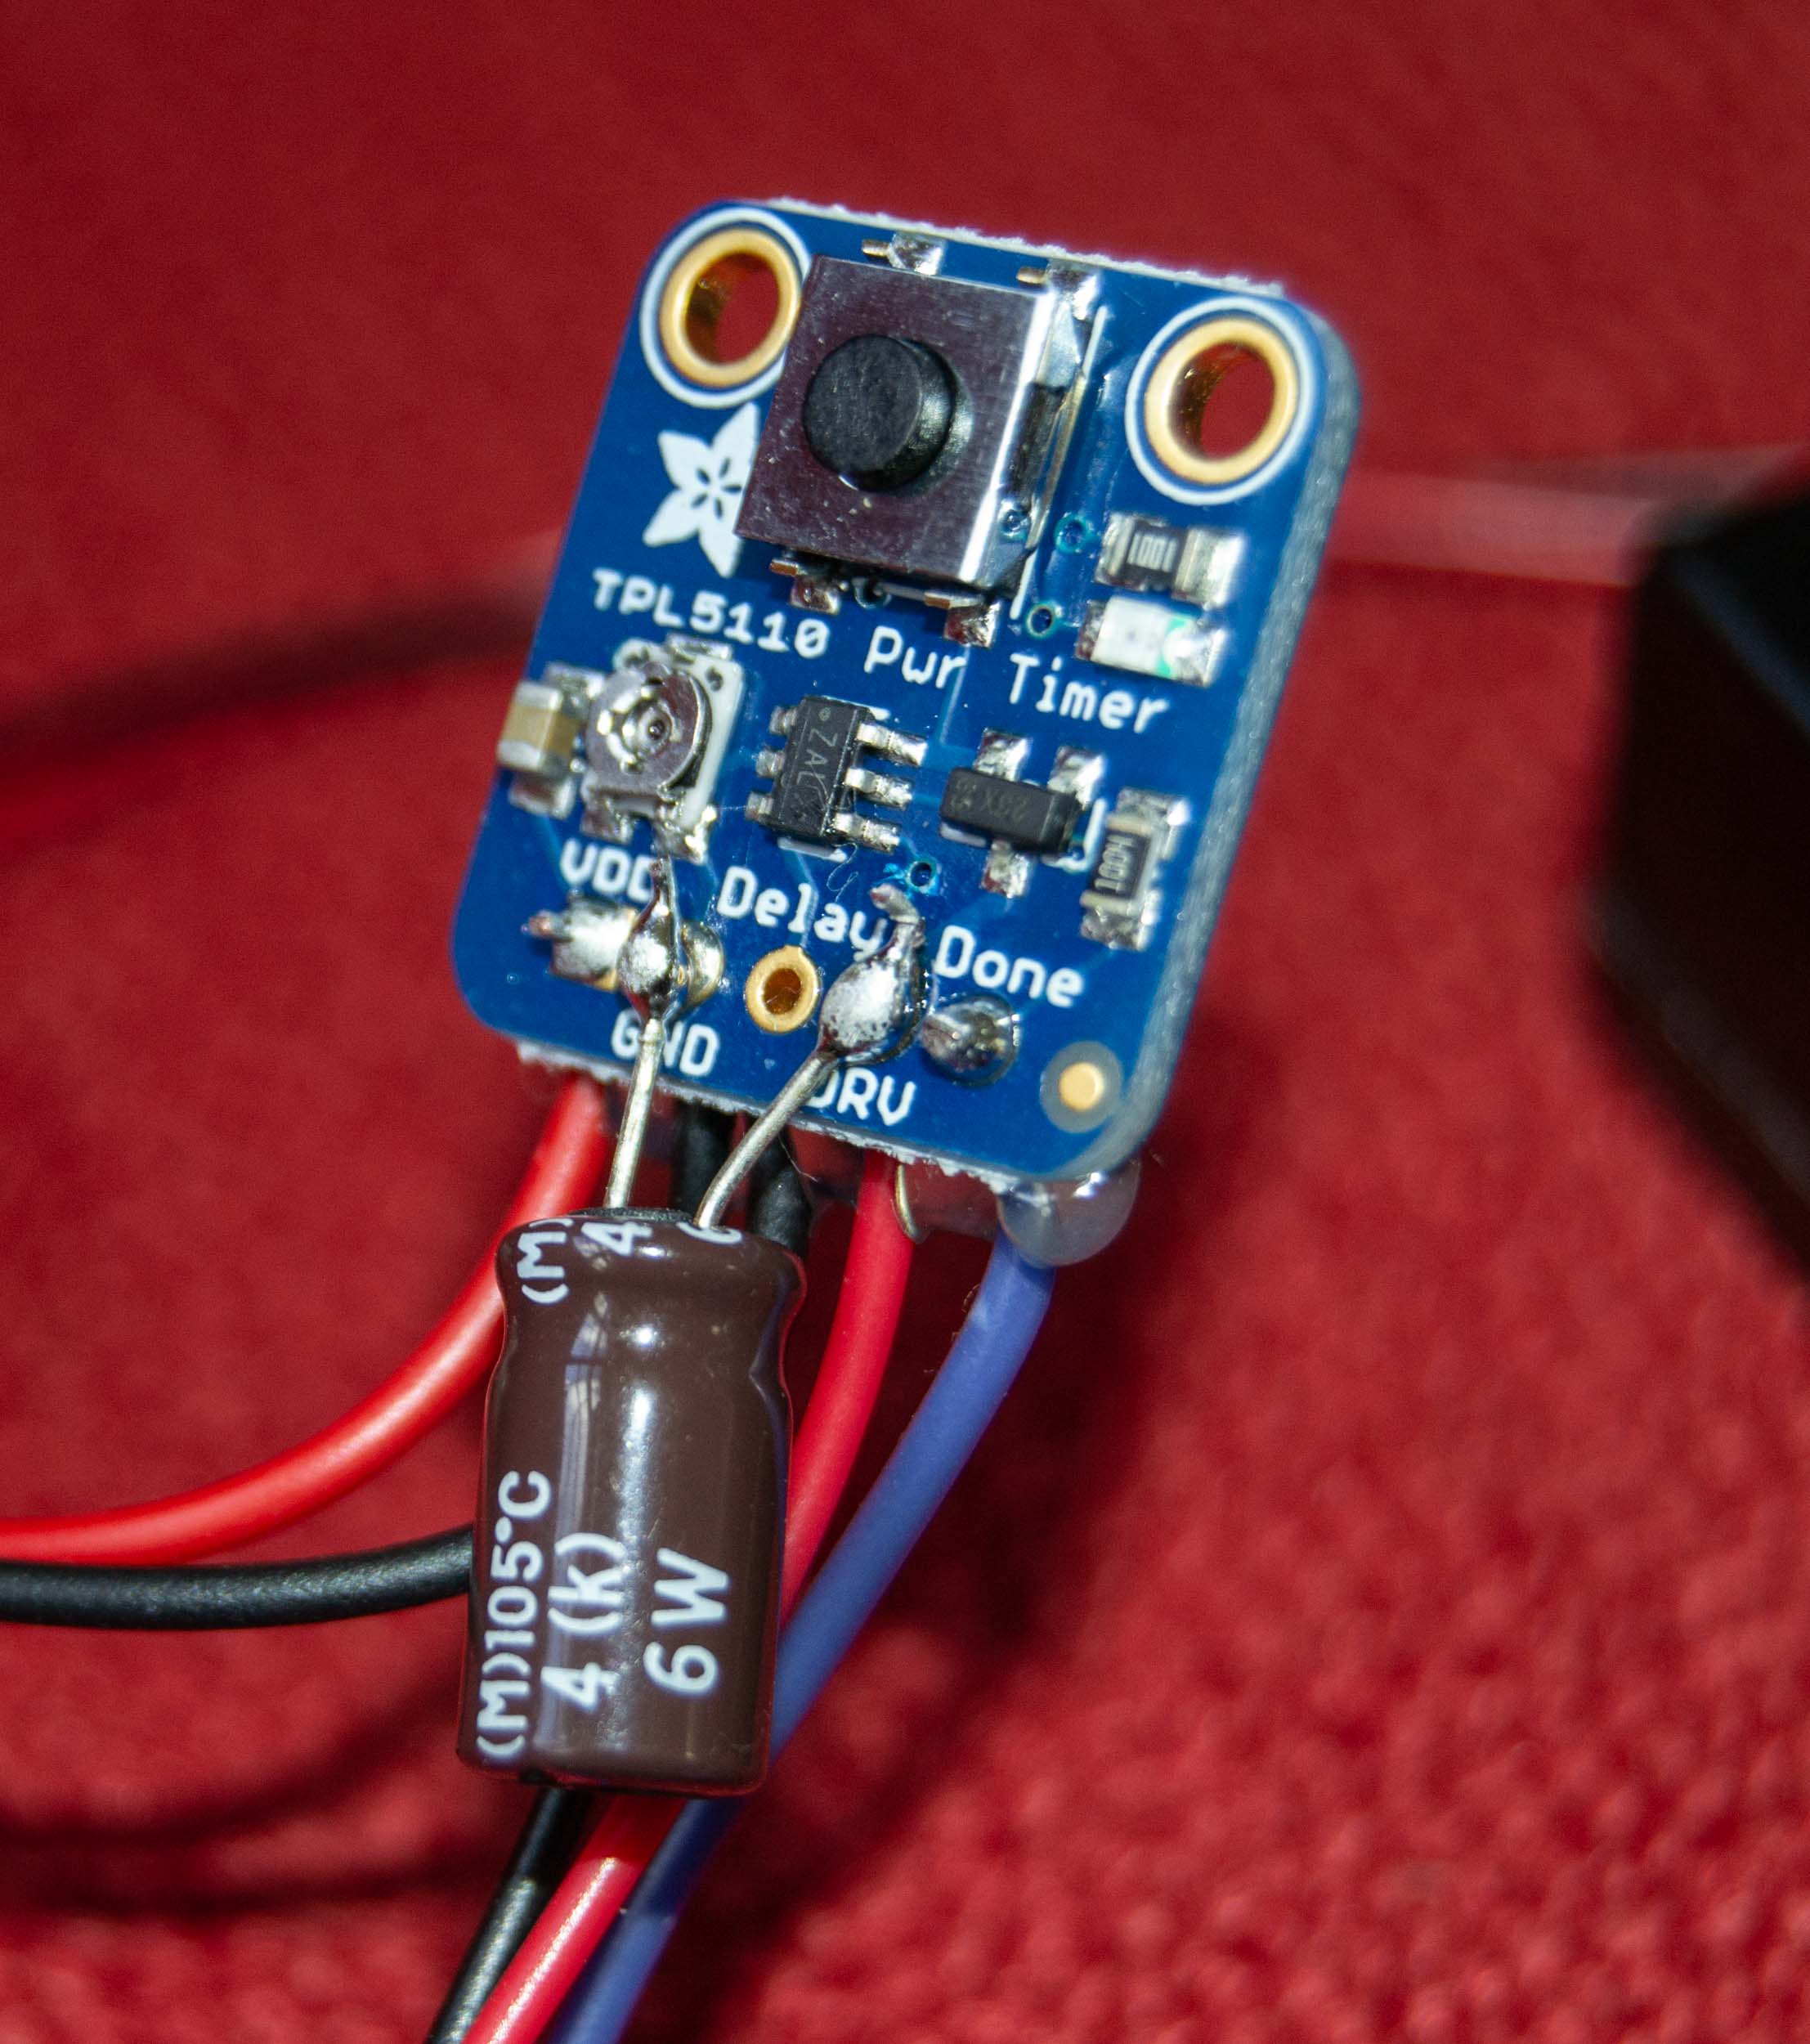
A standard Arduino microcontroller does not have enough memory to operate the four sensors I wanted to use. So a Mini Pearl Logger or any Arduino with the 328p chip (e.g., Uno, Nano, Pro Mini) was not up to the task. I thought this would be a good opportunity to exploit the extra memory and power of an ESP8266 but I planned to use a low-power timer to allow this logger to run on batteries all summer, and ESP8266 boards don’t work well with TPL5110 timers. The internets have various explanations for this and even some solutions (add a capacitor here or there) but I could not make it work. I had a couple Trig Boards which combine an ESP8266 and a TPL5111 timer, but that board does not have enough GPIO pins exposed for this project. I sent an email to the developer asking if I could solder directly to the legs of the ESP chip, but by the time he replied I had moved on. I considered using an ESP32 board, but only for about five minutes at which point I realized how different they are from legacy Arduinos. Then I found my pile of Adafruit Feathers.
I had a couple of Adafruit Feathers with the ATSamD21 chip which has plenty of memory. These cost about six times more than an ESP8266 board, but I had run out of cheaper options. At first it failed to work with the TPL5110 timer, but I tried the capacitor trick that internet people had used for the ESP8266 and it solved the problem. I don’t know what the problem was or why the capacitor fixed it and I didn’t try to find out. I was already a couple of weeks into this two-day project and not looking back.
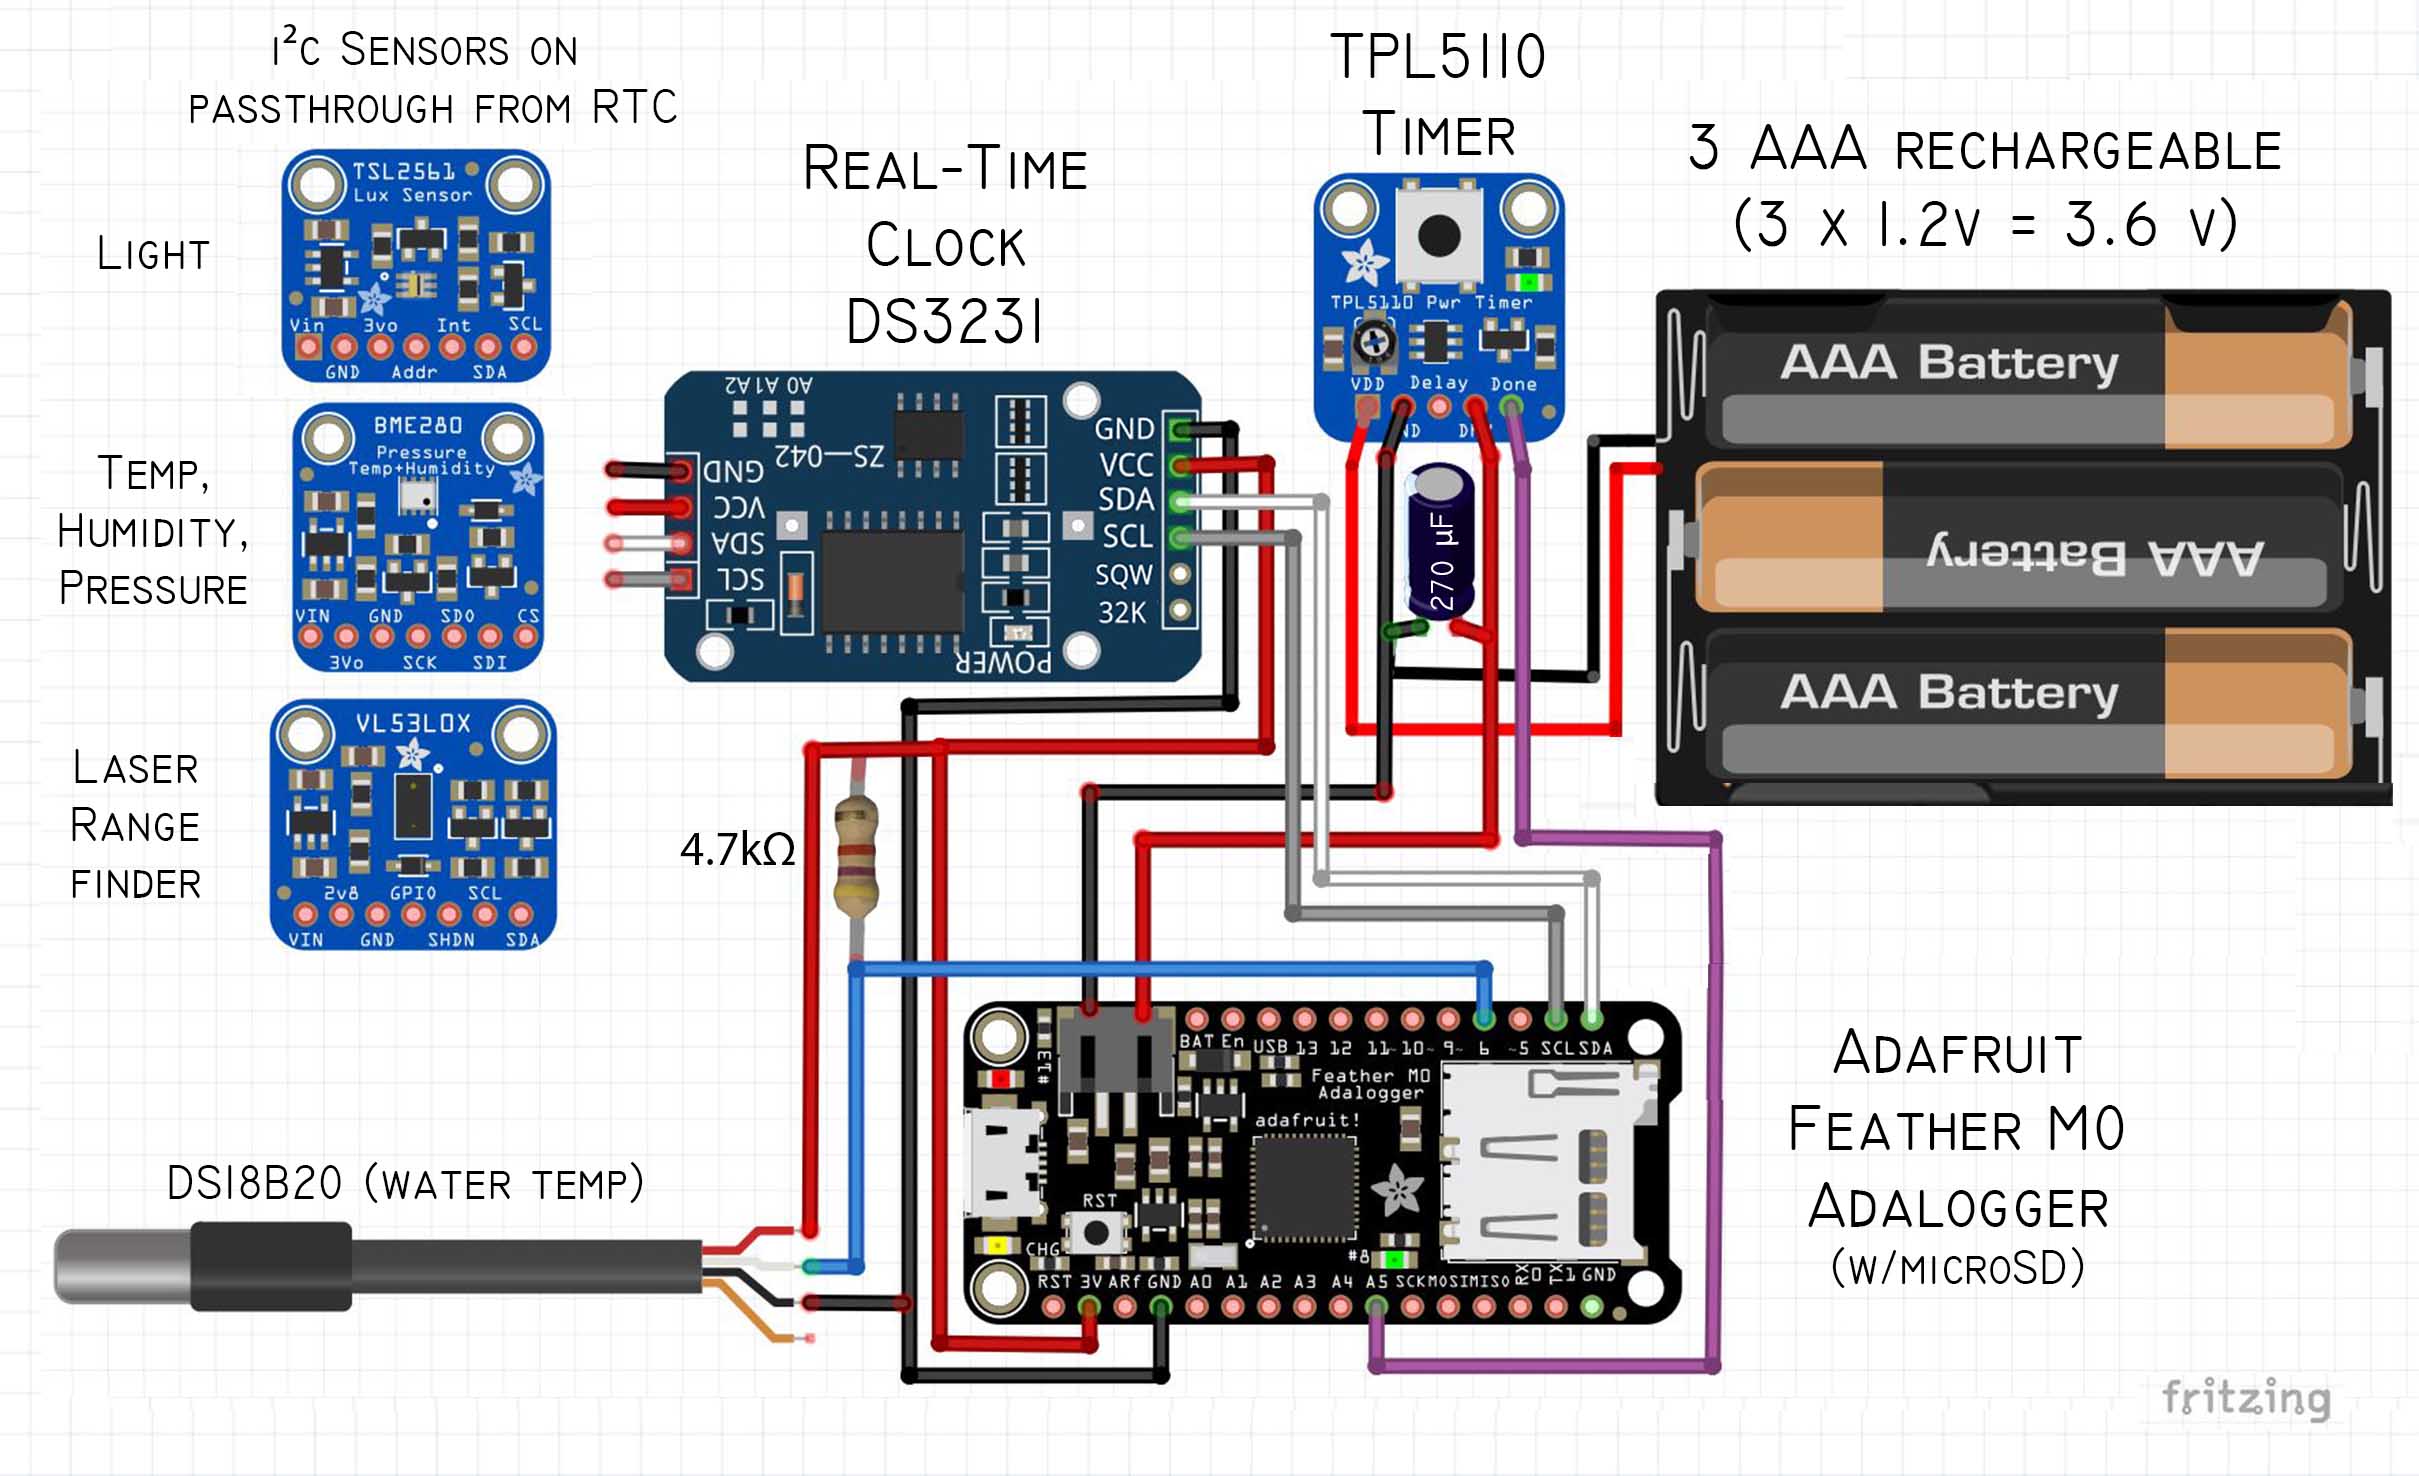
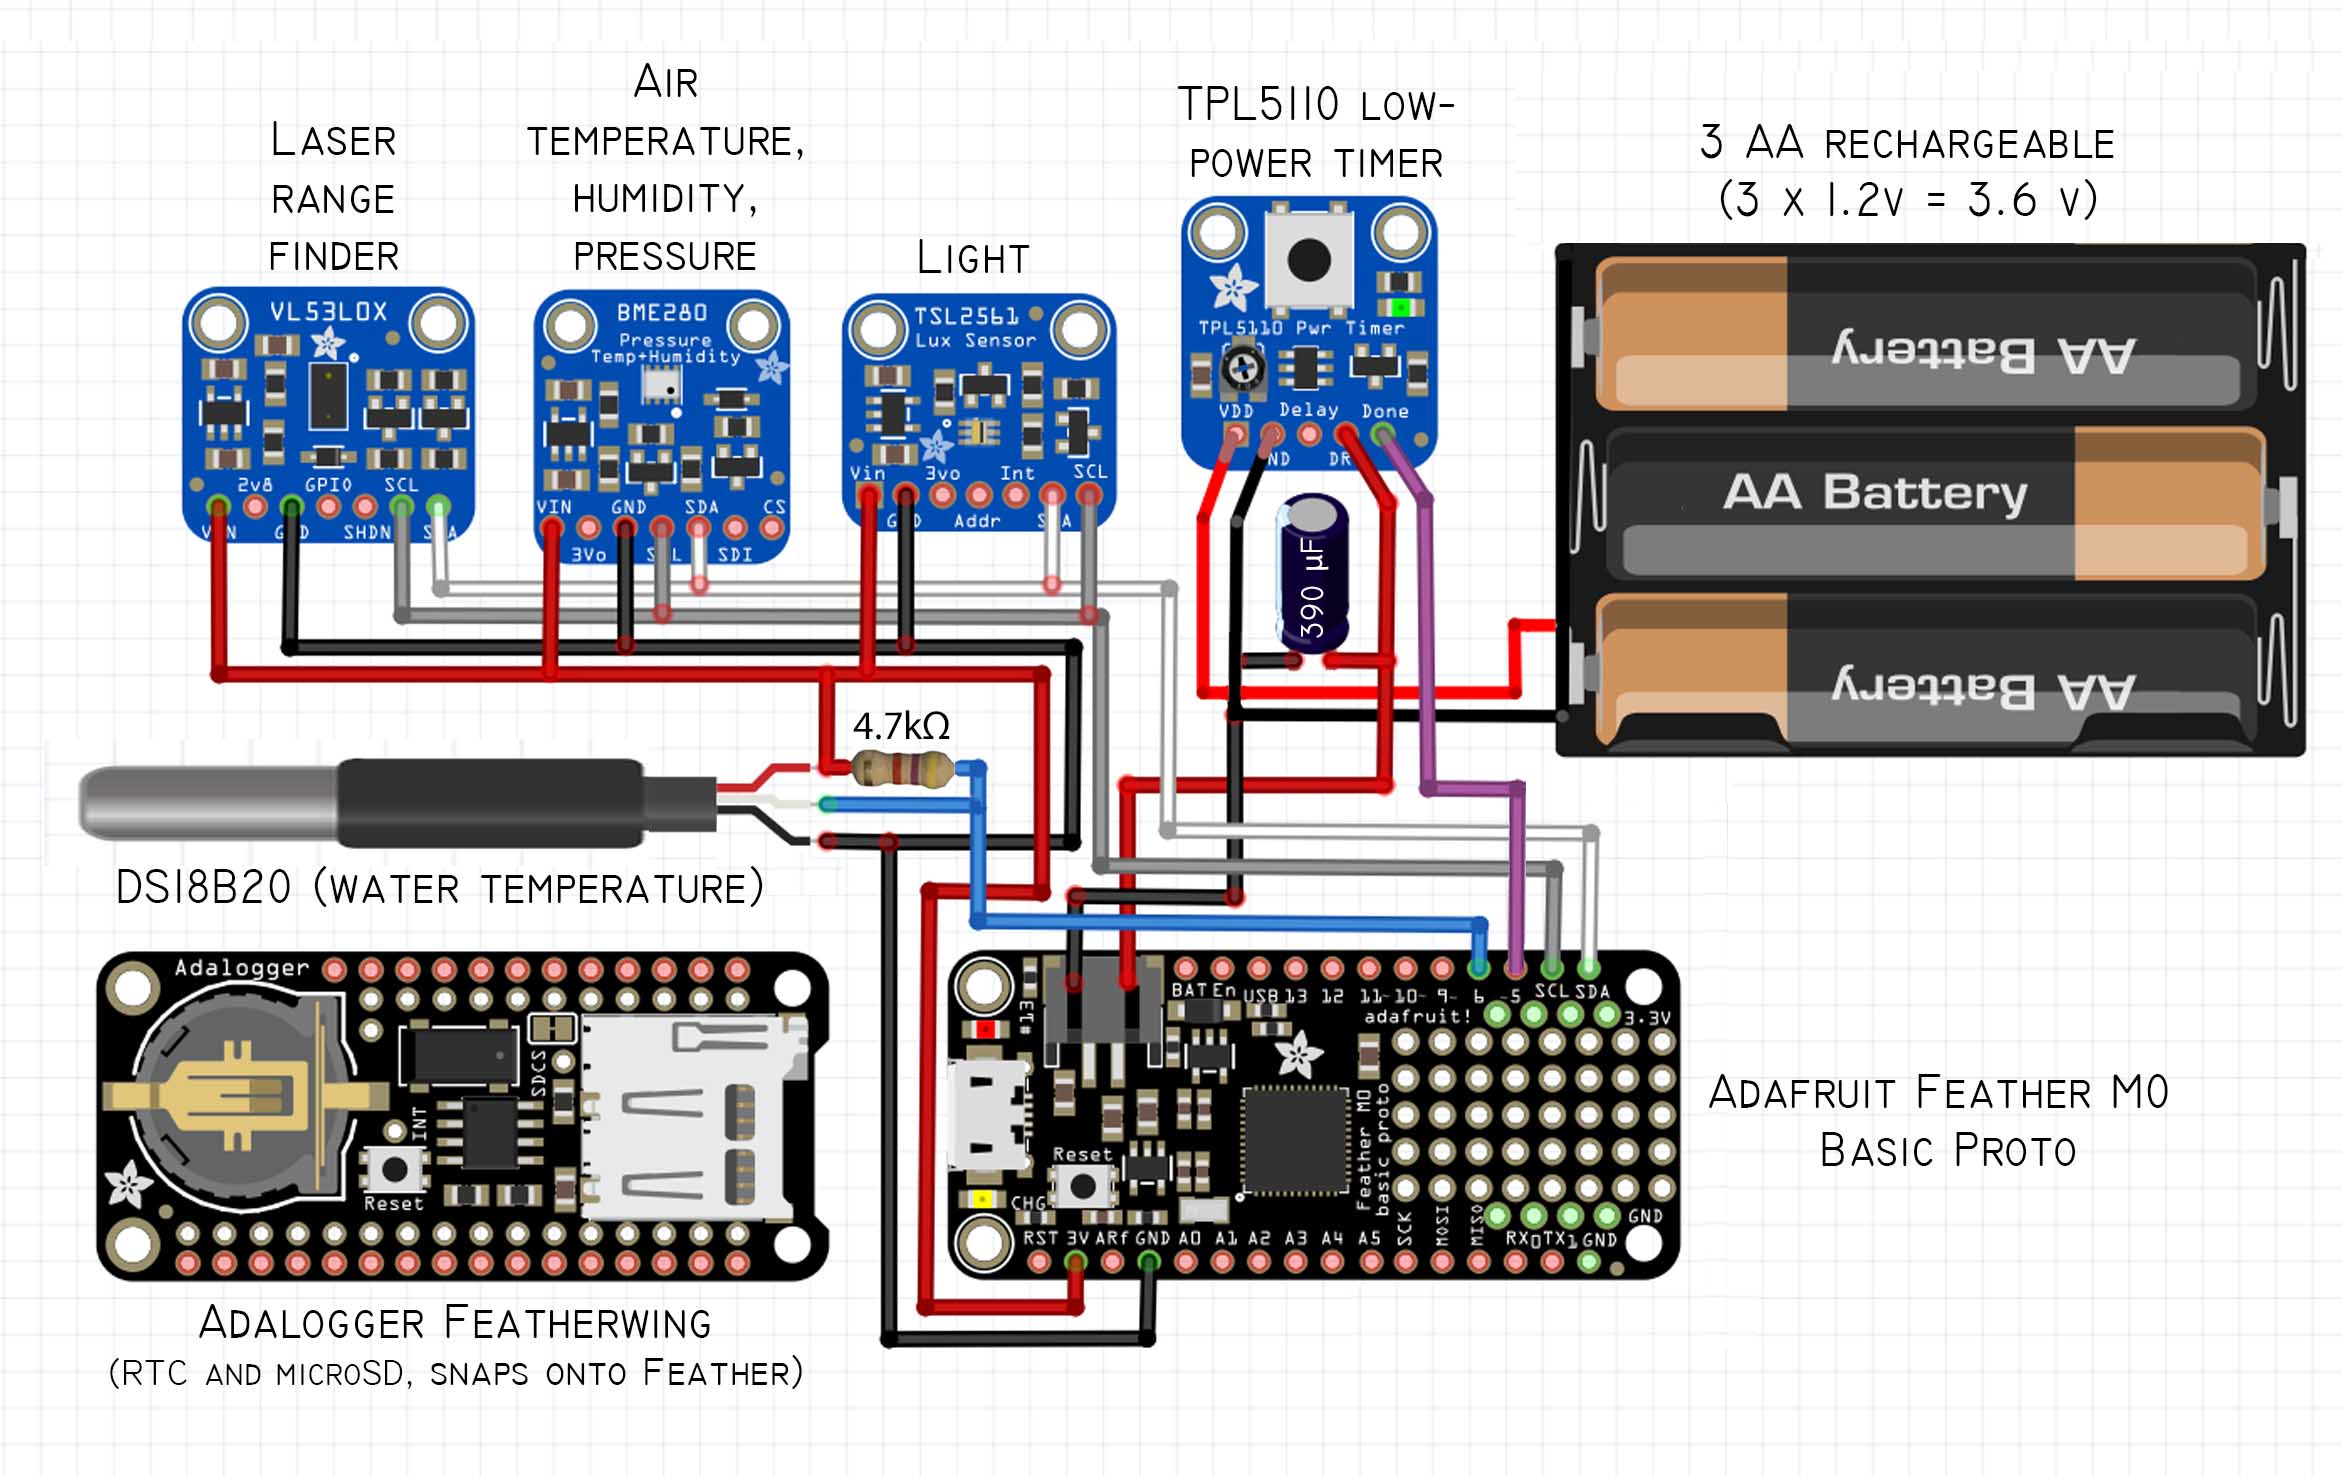
I made two versions of the logger. They used different Adafruit Feather M0 boards, but both had the same sensors and saved more or less the same data. The first used an Adafruit Feather M0 Adalogger which has a microSD card slot. The second used an Adafruit Feather M0 Basic Proto plus an Adalogger Featherwing which has both a real-time clock and microSD slot. The latter version is slightly more expensive but requires less complicated soldering.

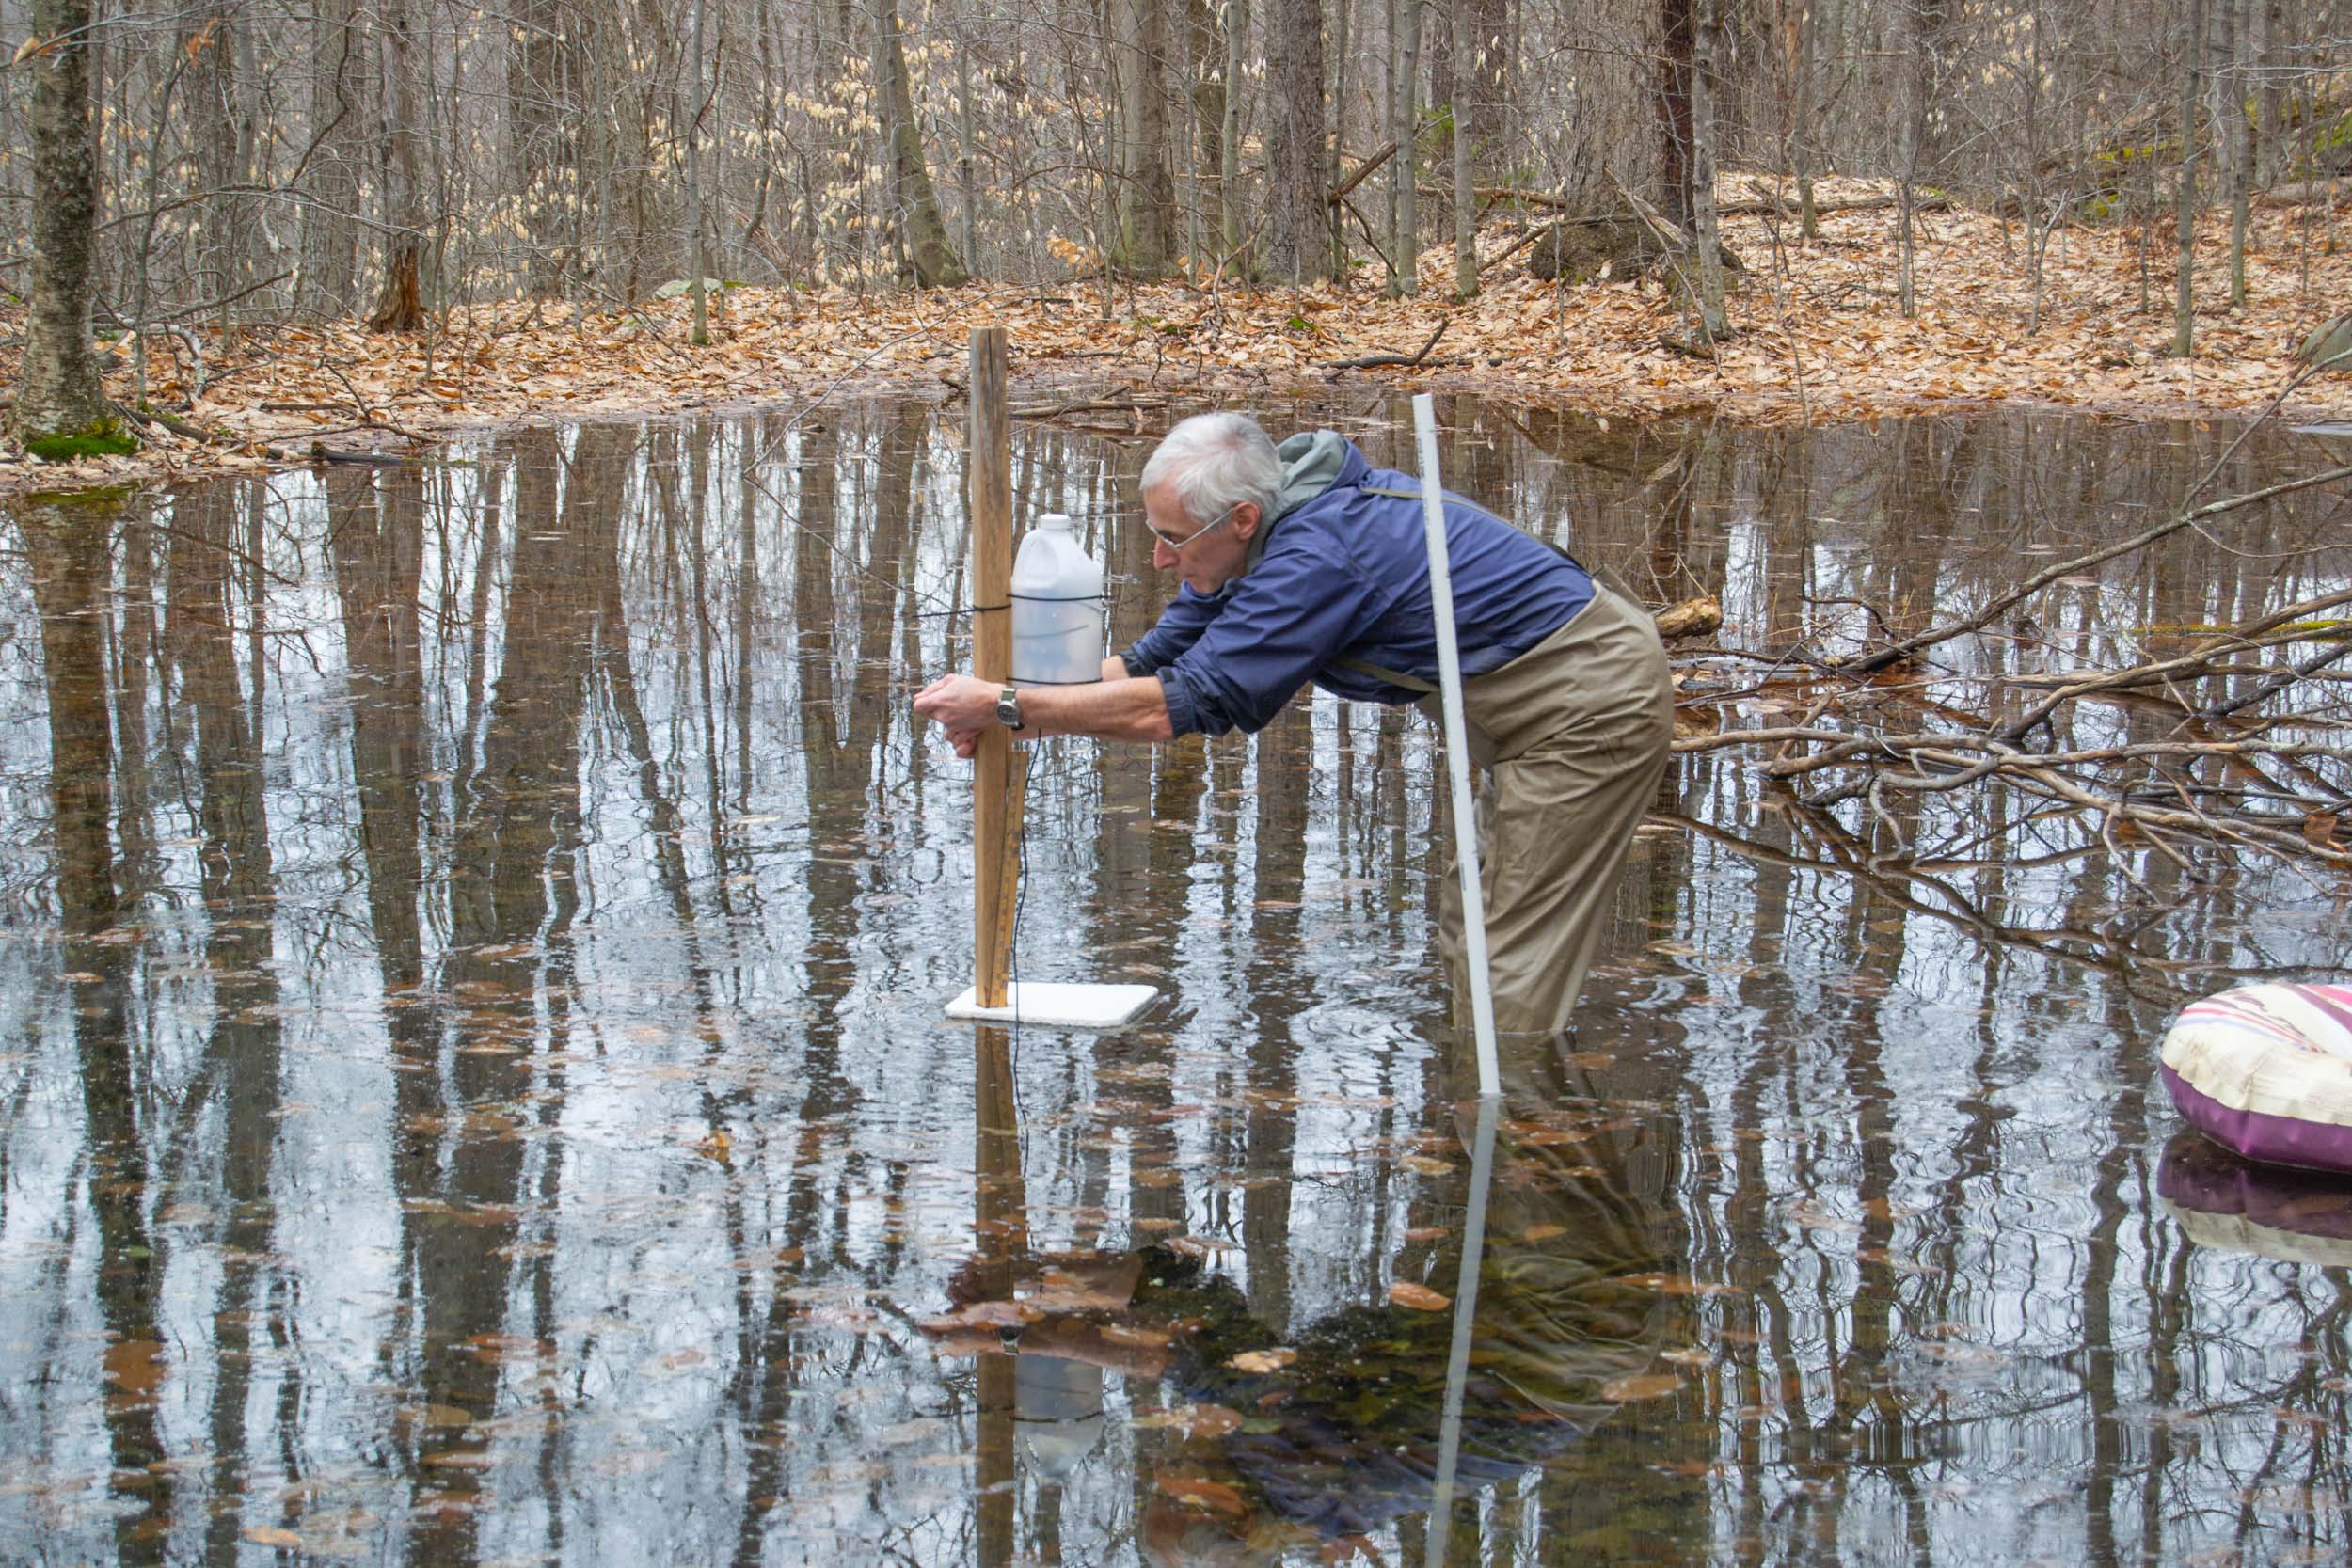
A key component of the data logger is a laser rangefinder (VL53L0X) which measures short distances. The logger is mounted above the water on a post in the deepest part of the vernal pool with the rangefinder pointed straight down at the water. Every hour the distance down to the water surface is recorded. During installation we used a yardstick to measure the height of the sensor above the pond bottom so the water depth could be computed. The water surface is not a reliable reflector of the laser beam, so a Styrofoam float surrounds the post and provides a better target. Even with the target, the rangefinder does not work in daylight because the sensor is saturated by sunlight. So we get reliable measurement data only at night.

To determine which of the distance measurements were reliable, the logger included a light sensor (TSL2561). The first logger was programmed to record distance measurements only when it was dark, but the second also records them in daylight just so I can see what they look like. The light sensor data can be used later to eliminate the unreliable distance data recorded in daylight.
A DS18B20 temperature sensor was included to measure water temperature. This sensor is sold in a waterproof probe at the end of a 2 m cable. The cable dangles down into the water from the post-mounted logger.
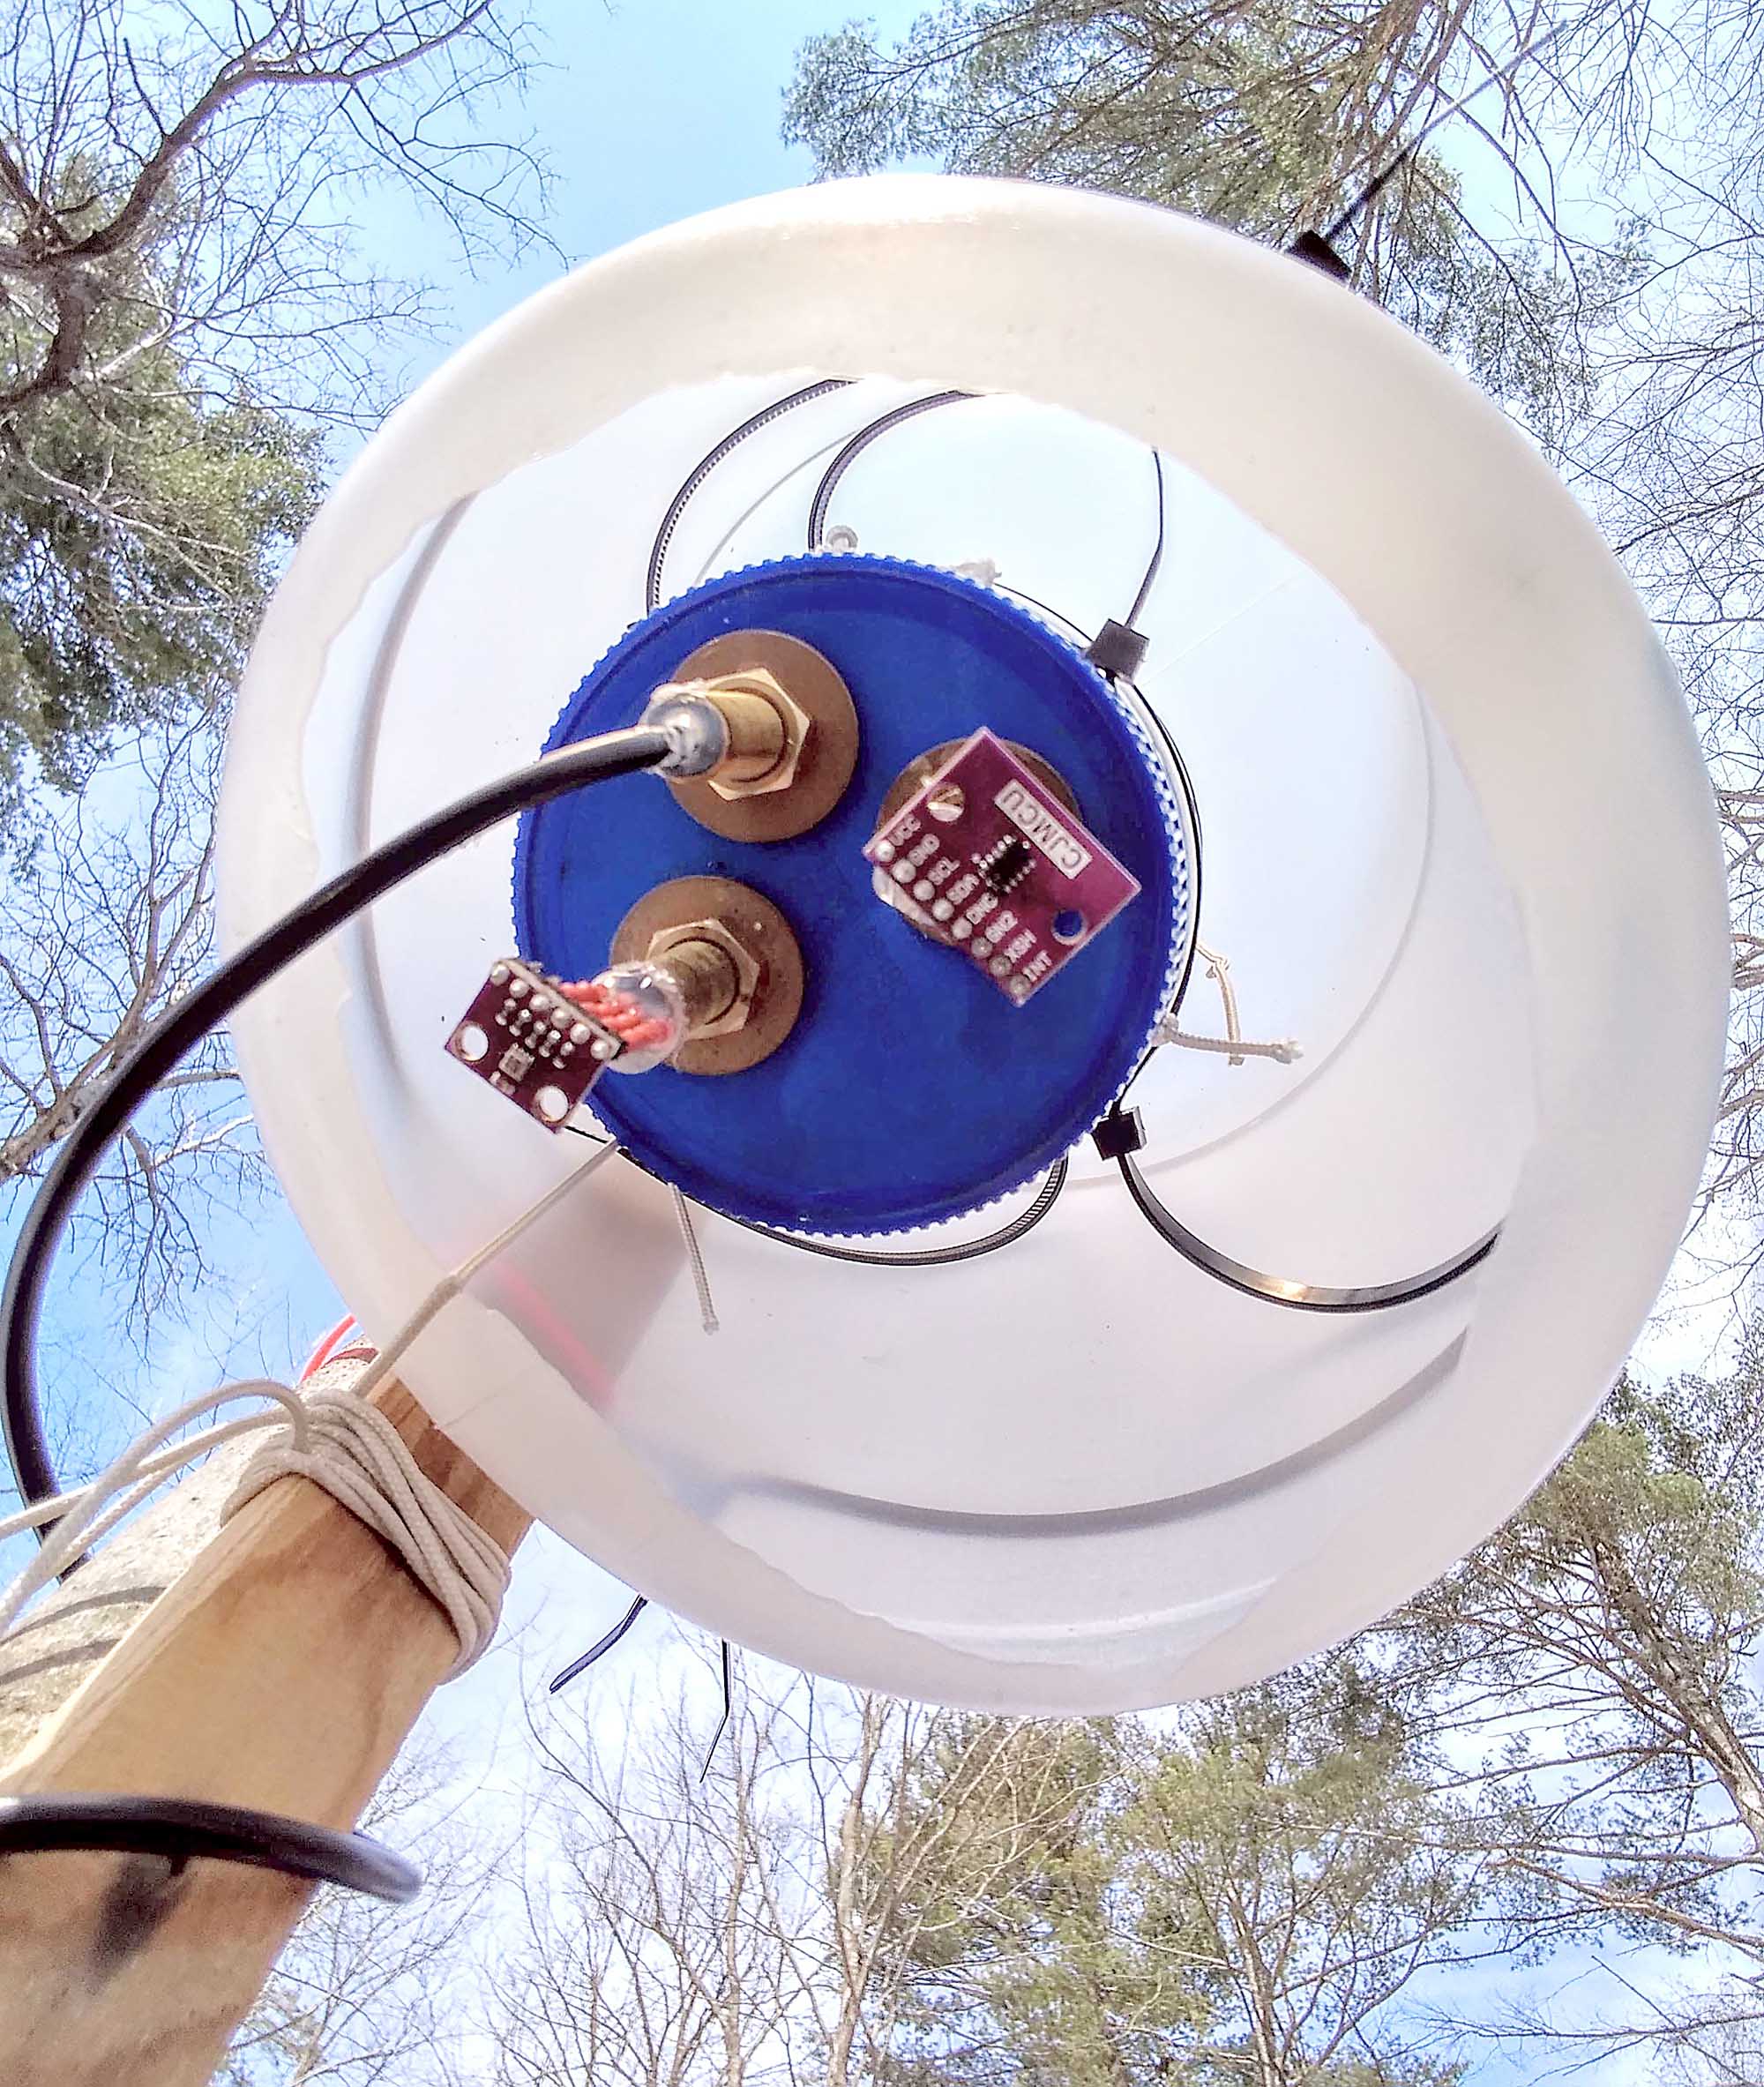
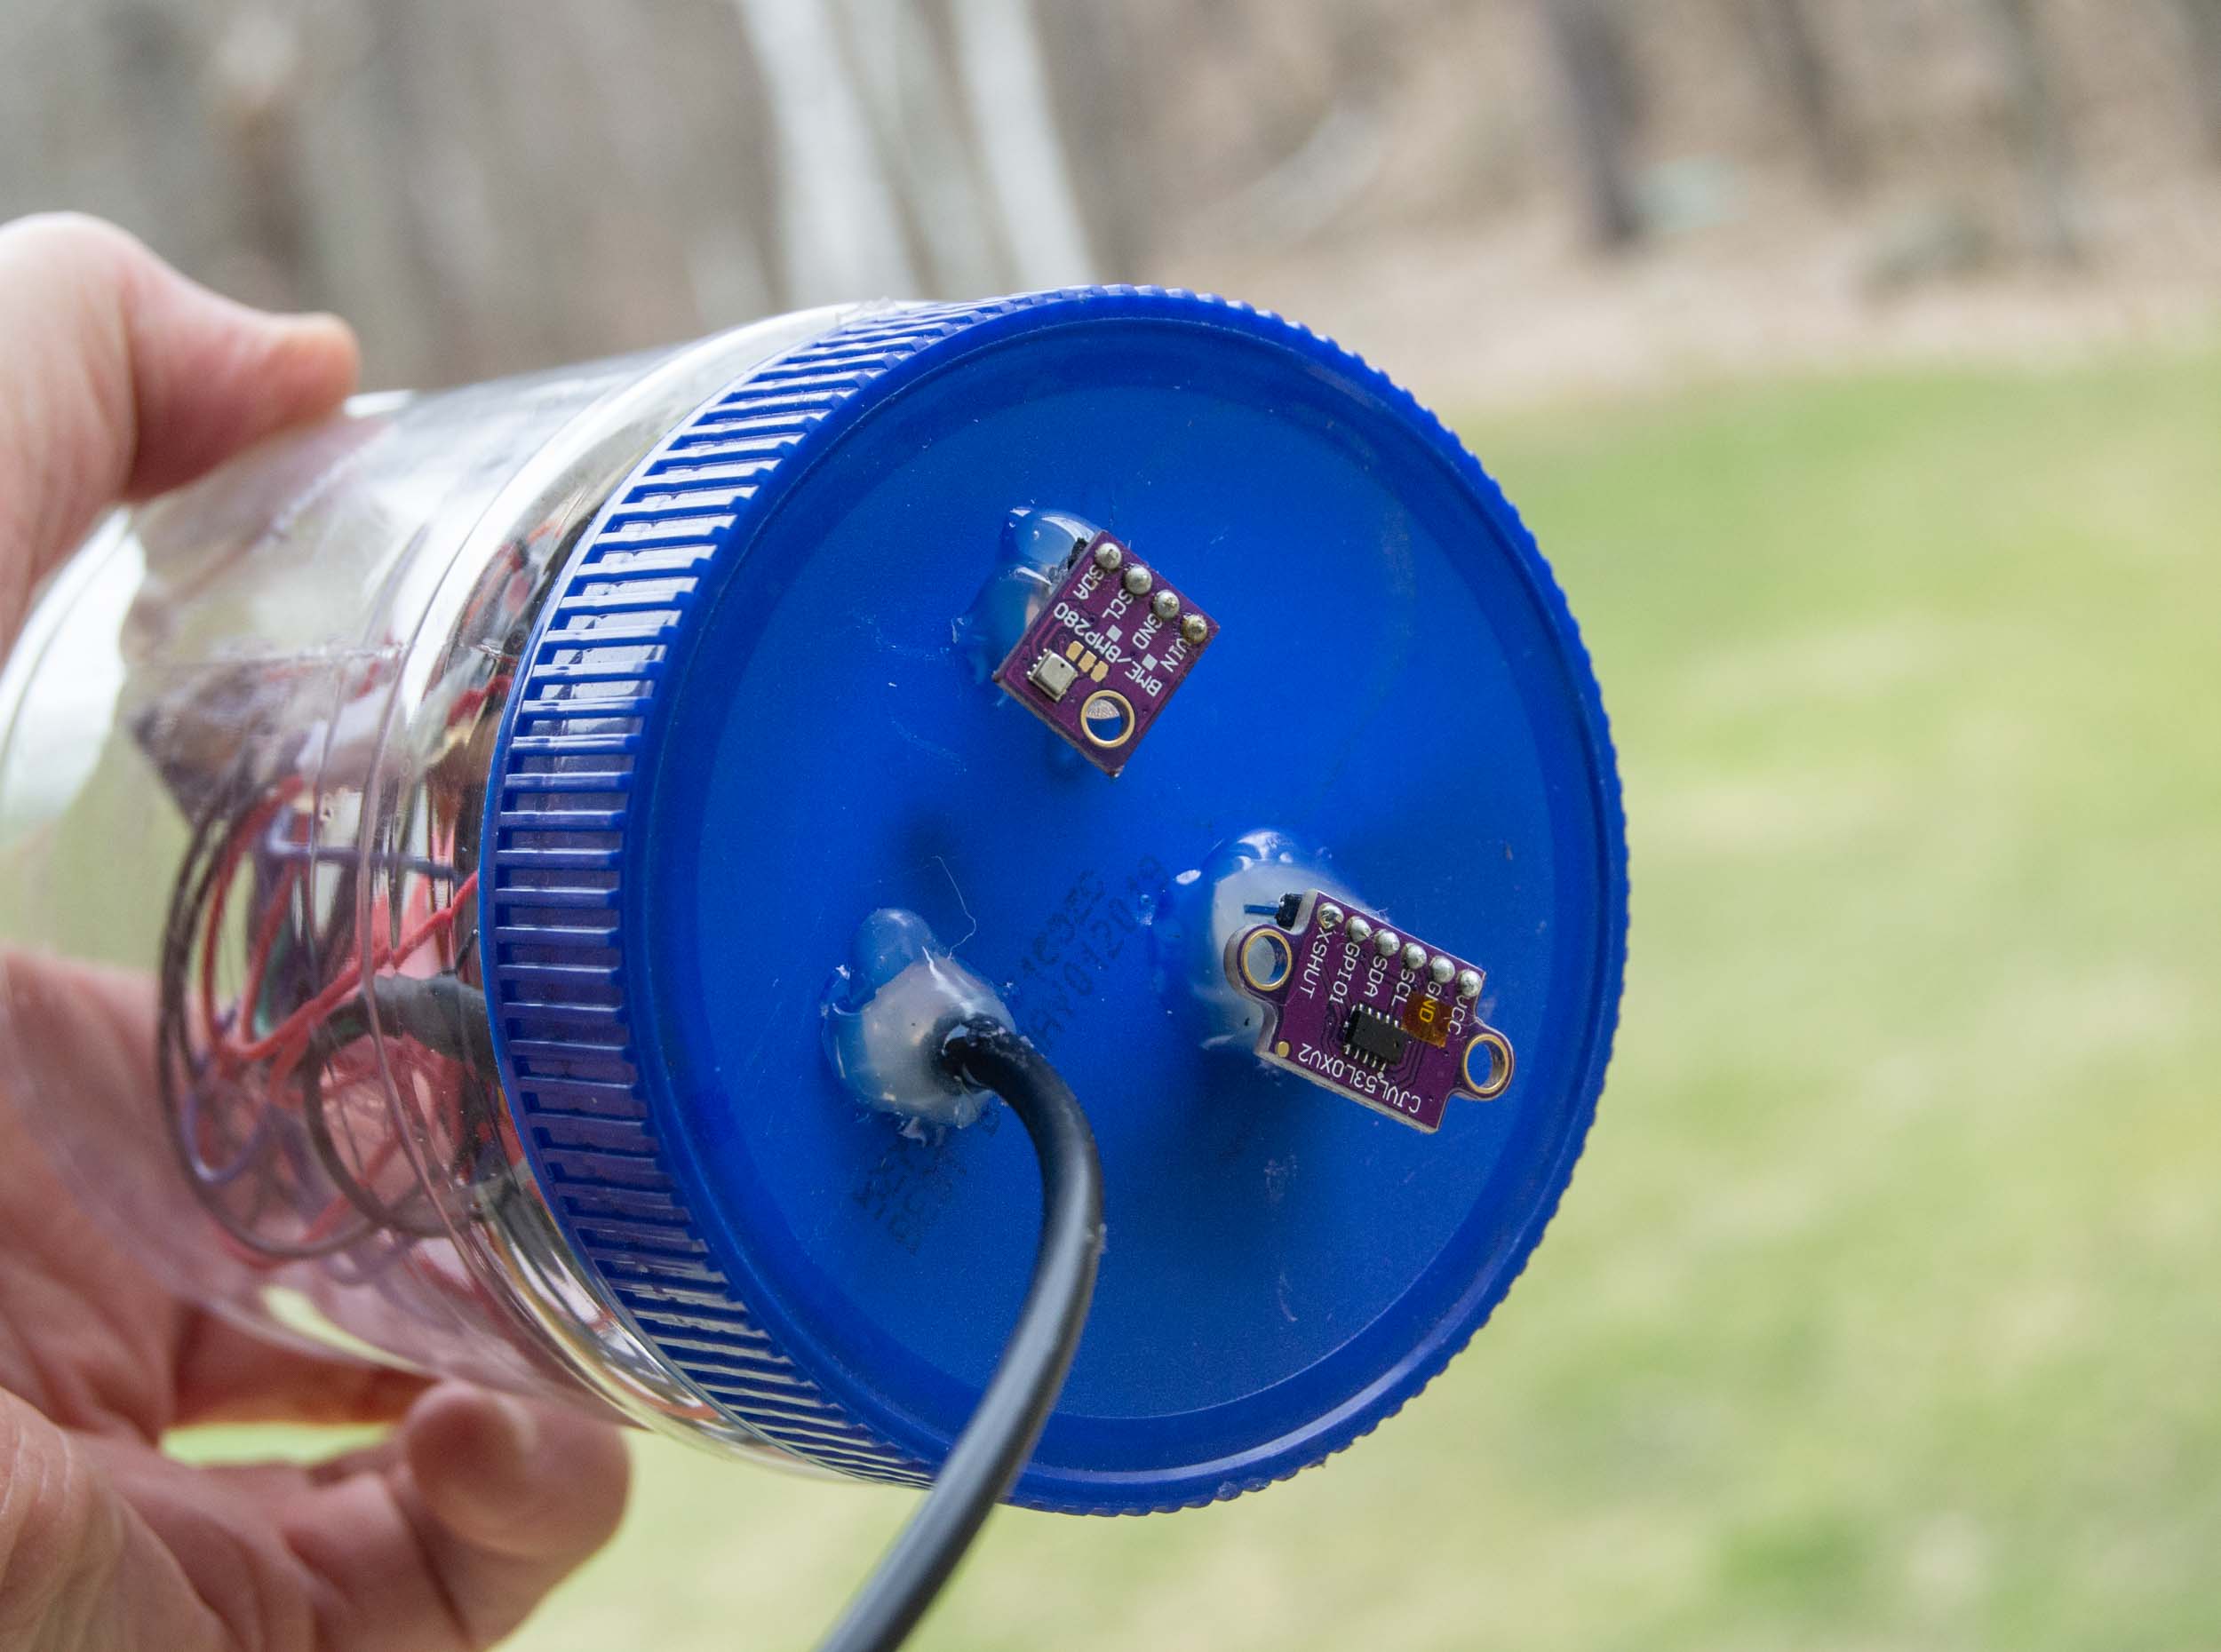
The final sensor (BME280) measures air temperature, humidity, and barometric pressure. Most of the logger electronics were sealed inside a 28 ounce plastic peanut butter jar, but this sensor and the laser rangefinder must be exposed to the elements to do their jobs. So they extrude from the jar but are protected under a plastic jug (one gallon windshield washer fluid jug with the bottom removed).
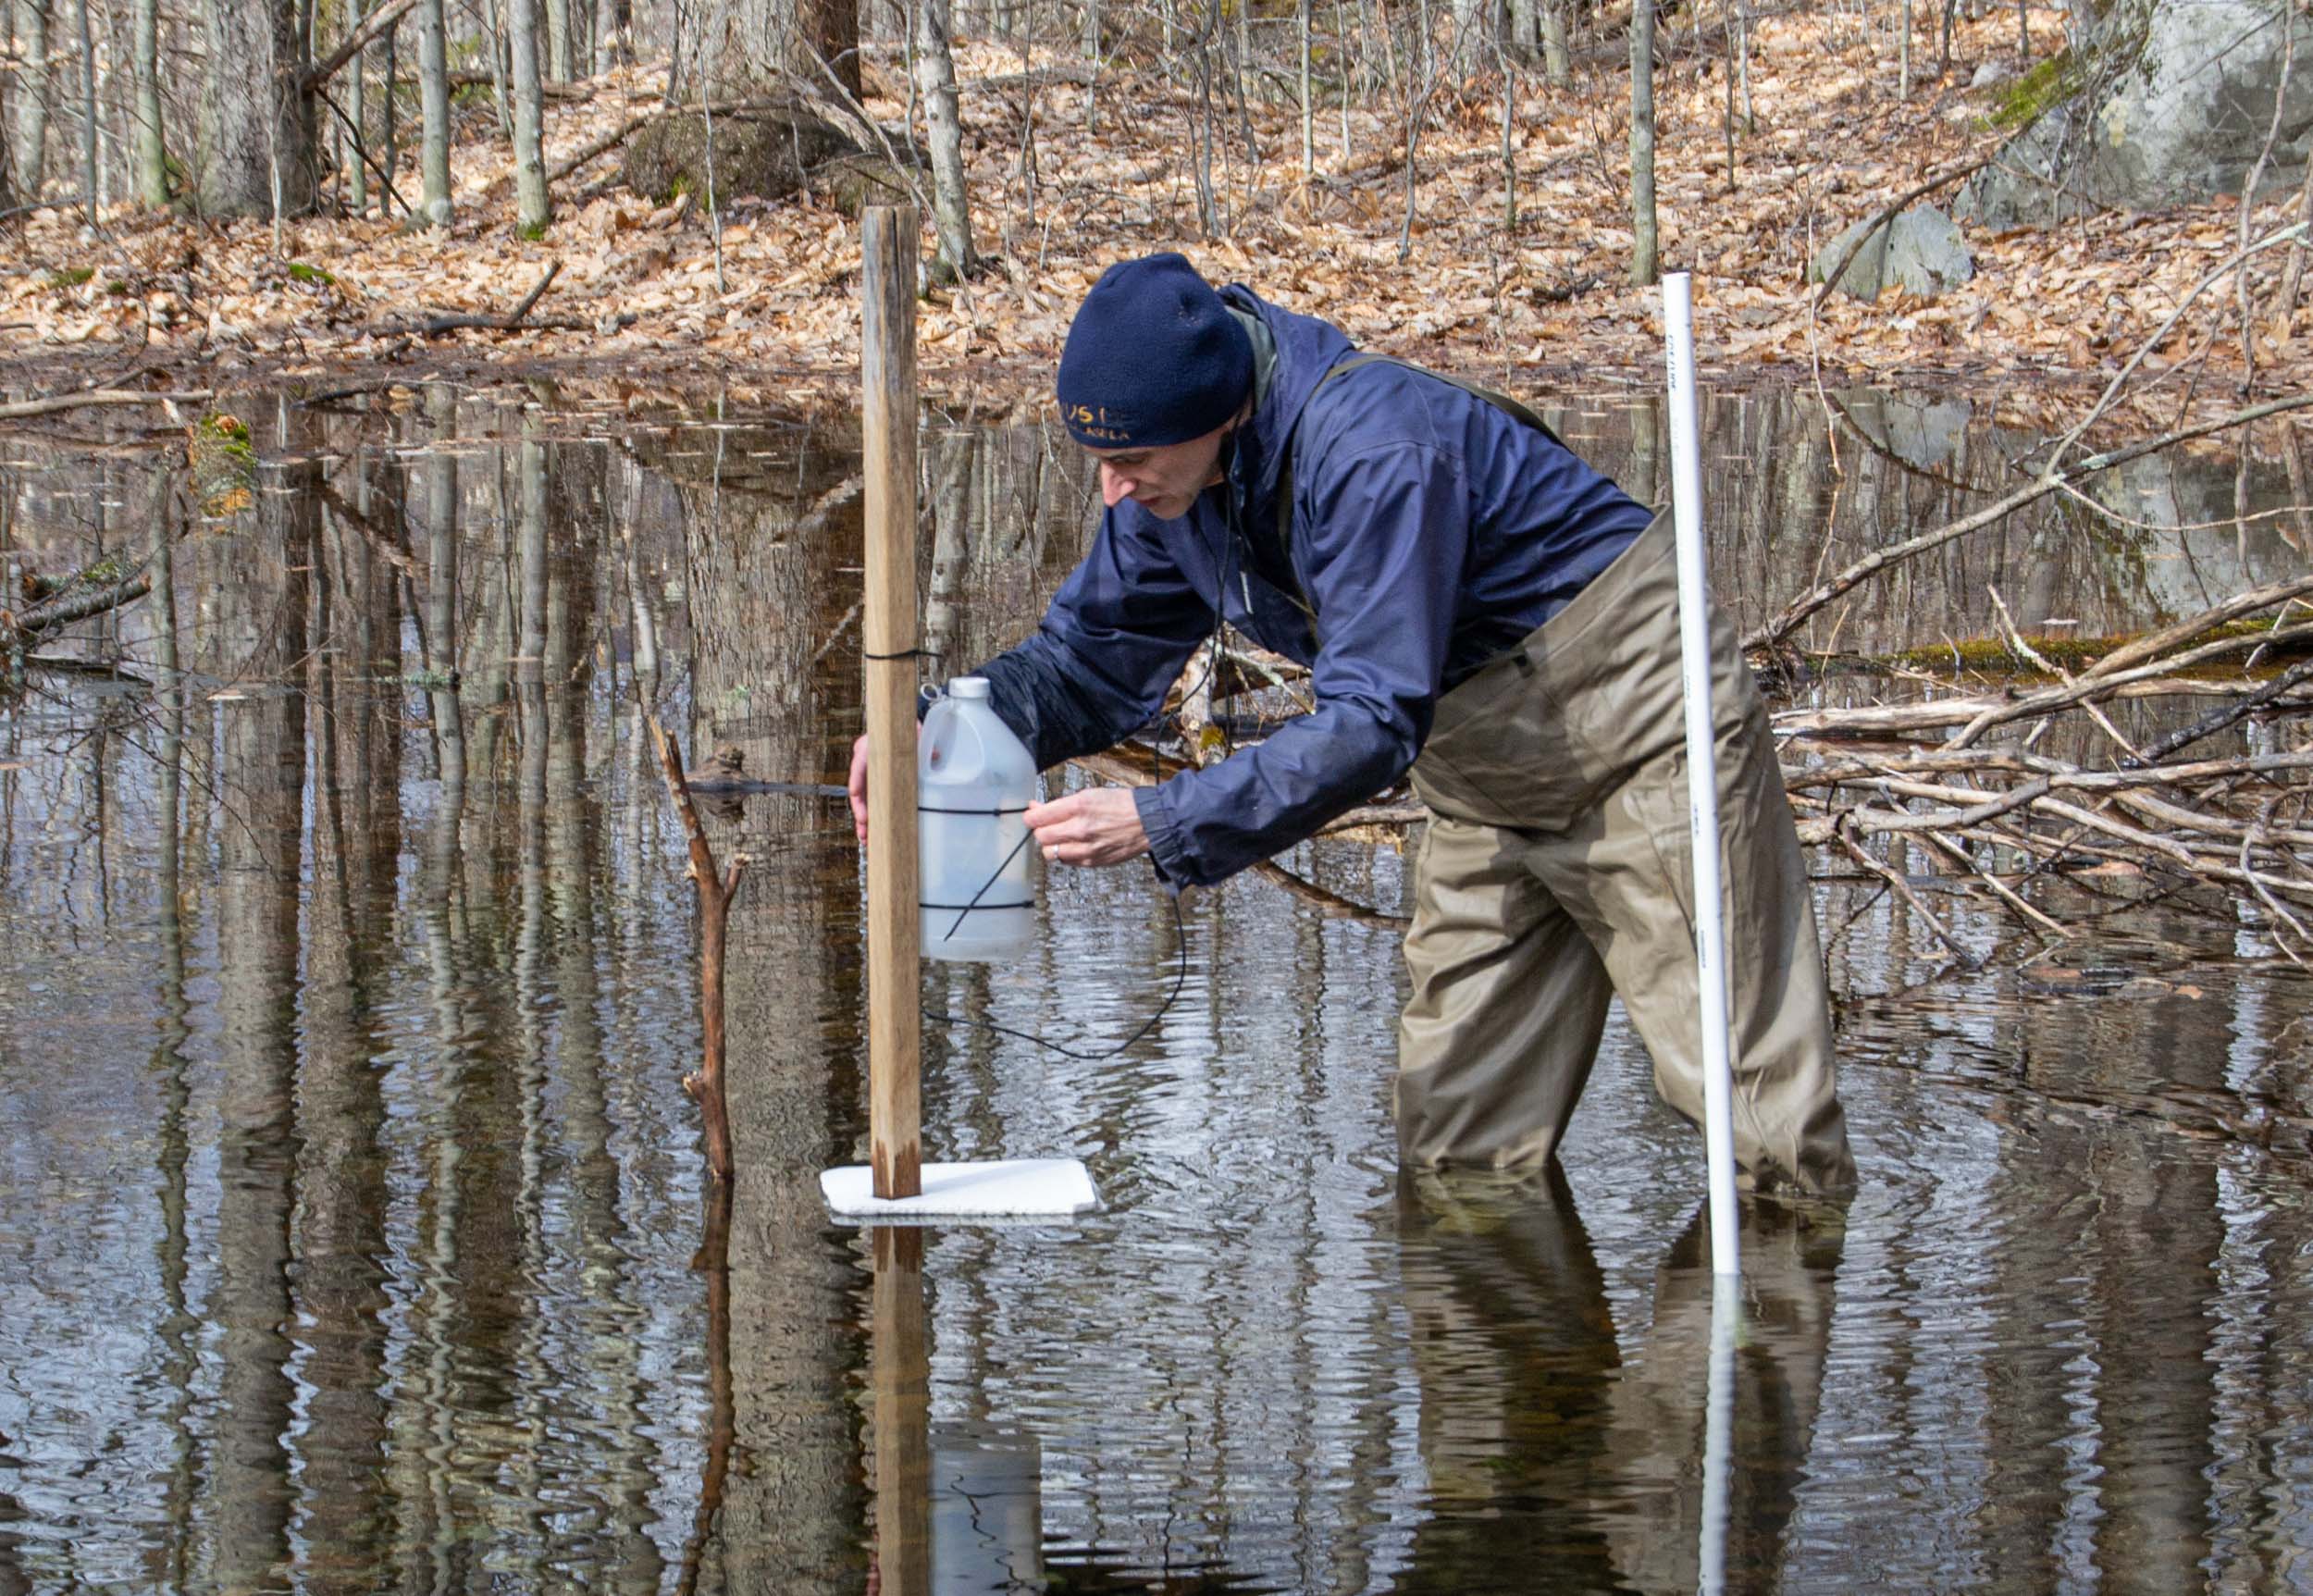
Installing the second version of the logger on April 17, 2020. The rangefinders have a range of about 1.2 m, so the range of water depth fluctuation has to be less than that. Our post was installed in about 20 inches (50 cm) of water and the sensor was about 32 inches (82 cm) above the pond bottom. The white PVC pole is marked in cm so the water depth can be determined from shore (just like they did in the old days).
This data logger should be able to run all summer on three AA batteries. That’s because the logger is powered up only for about 10 seconds every 30 minutes. A timer (TPL5110) is powered continuously but draws very little current. It is set to send power to the data logger every 30 minutes (60 minutes for the first version). The data logger is programmed to collect data from each sensor, save it to the microSD card, and then send a signal to the timer to turn off the power. The logger needs 10 seconds because 20 measurements are made of the distance down to the Styrofoam float. It computes the mean and standard deviation and saves those values. It reads the other three sensors only once per period (those sensors are less noisy than the rangefinder).
When we replaced the version 1 logger with version 2, we got to see if version 1 was working and to look at the data for the first three weeks. We also retrieved the data from the HOBO temperature logger in the pool. This allowed a comparison to see if the two loggers recorded similar results for water temperature (Graph 1).
The two temperature sensors were about four feet apart, and both loggers recorded 2° to 4°C fluctuations in water temperature every day. This does not mean that all the water in the pool was warming and then cooling that much every day. On a clear day with the sun directly overhead and not filtered by trees the entire pool could warm 4°C in a day, but maybe not in April (the low sun angle means much sunlight reflects off the surface) and maybe not in partial shade with cold ground underneath and cold groundwater entering. But something was warming 2° to 4°C in just a few hours.
Both sensors were on the dark pool bottom which must have been warming up when it absorbed sunlight. Sometimes there was as much as 1°C difference between the two sensors, especially in the middle of the day. This could be poor calibration of either or both sensors, but is probably a difference in their relationship with the rough-textured, leaf-covered pool bottom. When the sun warmed the bottom, the HOBO apparently sensed that change more than the DS18B20, or maybe the sun warmed the HOBO itself more than the DS18B20. When there was no sun shining on the pool, the two loggers usually record similar temperatures.
The laser rangefinder seemed to provide a very good record of subtle changes in vernal pool water level (Graph 2). Increases of 1 to 5 cm were recorded every time rain was recorded at a station 3.8 miles away in Middlebury. Pool water level increased more when it rained more. Consecutive days without rain were days when pool level dropped. This good correlation suggests that water level changes are well documented by the logger and that they are driven by local rainfall.
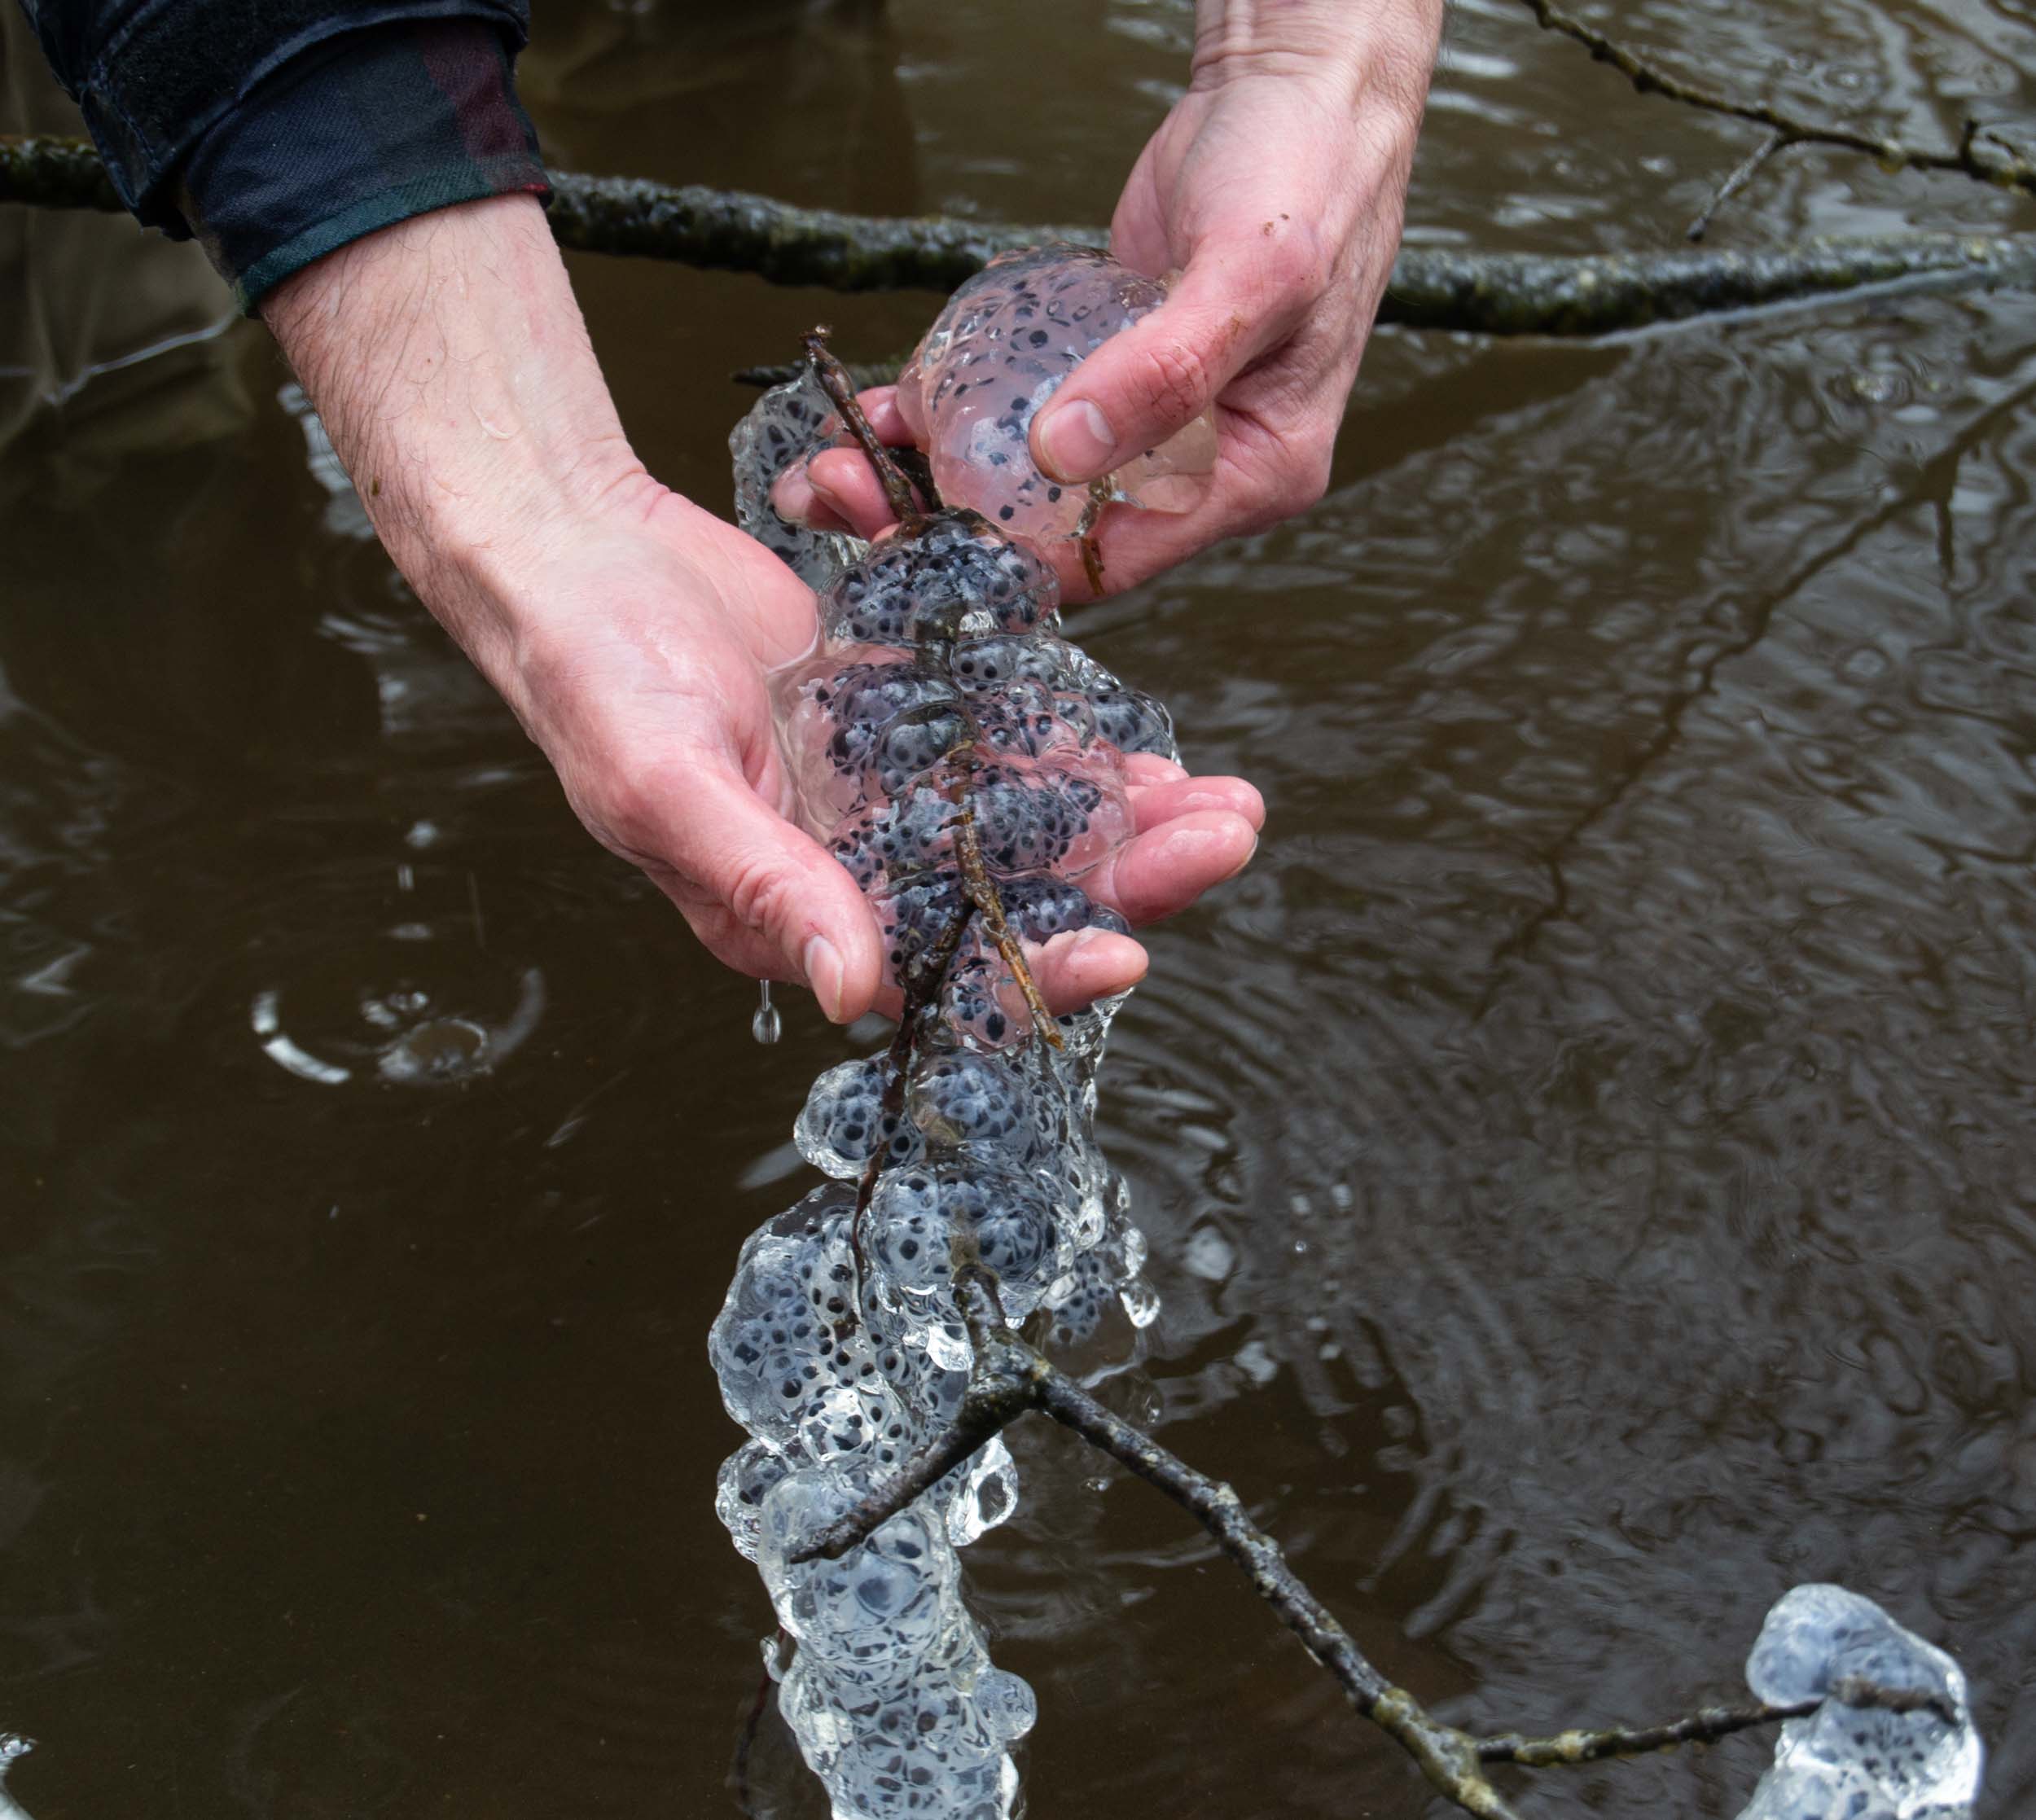
There was also a good relationship between water level and water temperature (Graph 2). When it rained, the water generally got colder. But most of these early spring rainy days were cold days (compare the air temperature in Graph 3). Then on April 13 (the blue rain cloud icon), it was both rainy and warm for the first time and pool water temperature increased while it was raining. The evening of April 13 was probably when the amphibian eggs were laid in the pool (I witnessed wood frogs calling and spotted salamanders depositing spermatophores that night in a pond 1.5 miles away).
Air temperature reached a peak each day in the late afternoon (Graph 3). Water temperature was highest on most days an hour or two after the peak in air temperature. That might be due to the greater thermal mass of the pool bottom compared to air. The saturated, decaying leaves on the bottom probably cool off more slowly after the sun has ceased to warm everything up. But I’m not sure why the bottom sediments would continue to heat up after the air has started to cool down.
We will probably let the version 2 logger continue to record data for the rest of the summer. But I’m not sure I can be patient enough to wait all summer to check if the logger is working and to see more data.
Bill of materials for version 2 of the vernal pool monitor
- Adafruit Feather M0 Basic Proto……………………..$20
- Adalogger Featherwing…………………………………$9
- Adafruit low-power timer………………………………..$5
- Laser rangefinder (VL53L0X)………………………….$7
- Light sensor (TSL2561)…………………………………$7
- Temperature, humidity, pressure (BME280)………….$1
- Water temperature sensor (DS18B20)………………..$3
- Battery case……………………………………………..$1
- MicroSD card……………………………………………$3
- Total…………………………………………………….$51
The HOBO data logger, which records only temperature, costs $54. There is no soldering or programming required, so it’s much less fun. You can upload the data to your phone via Bluetooth, although that didn’t work in the field the two times we tried it this spring.
Chris, very ingenious work – nicely done.
However, you say “The cable dangles down into the water from the post-mounted logger.” What was the angle of the dangle?
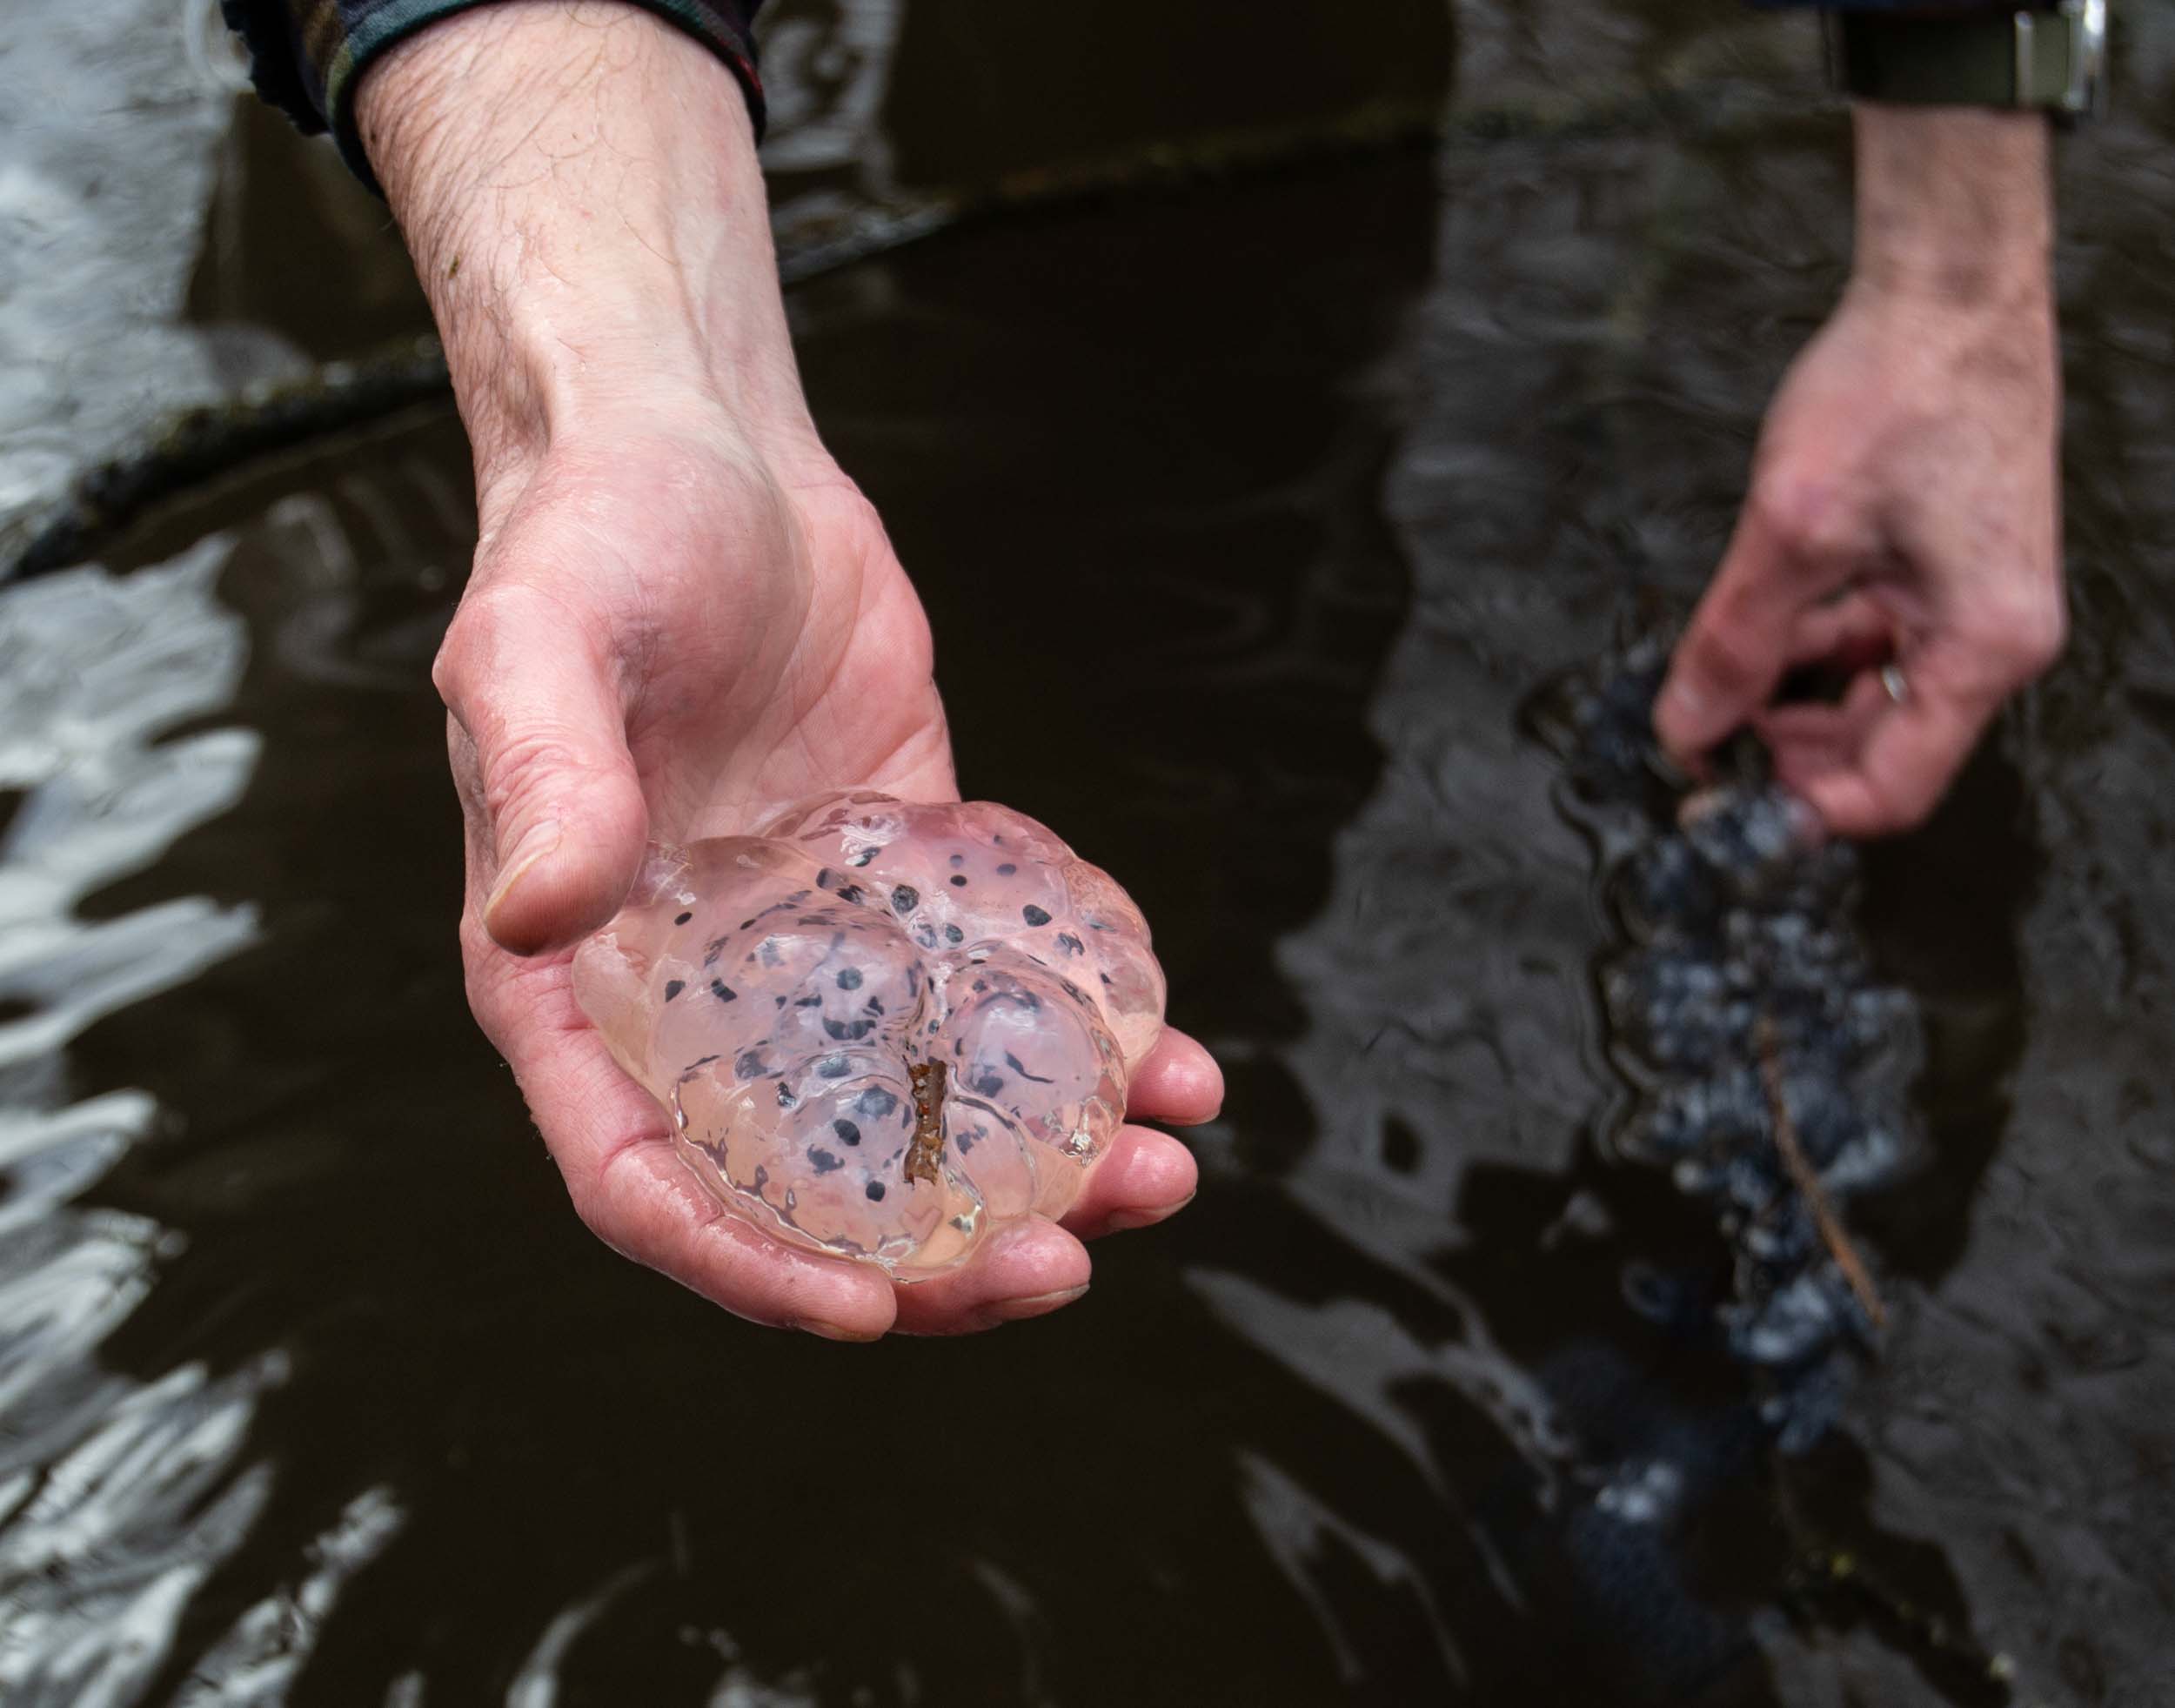
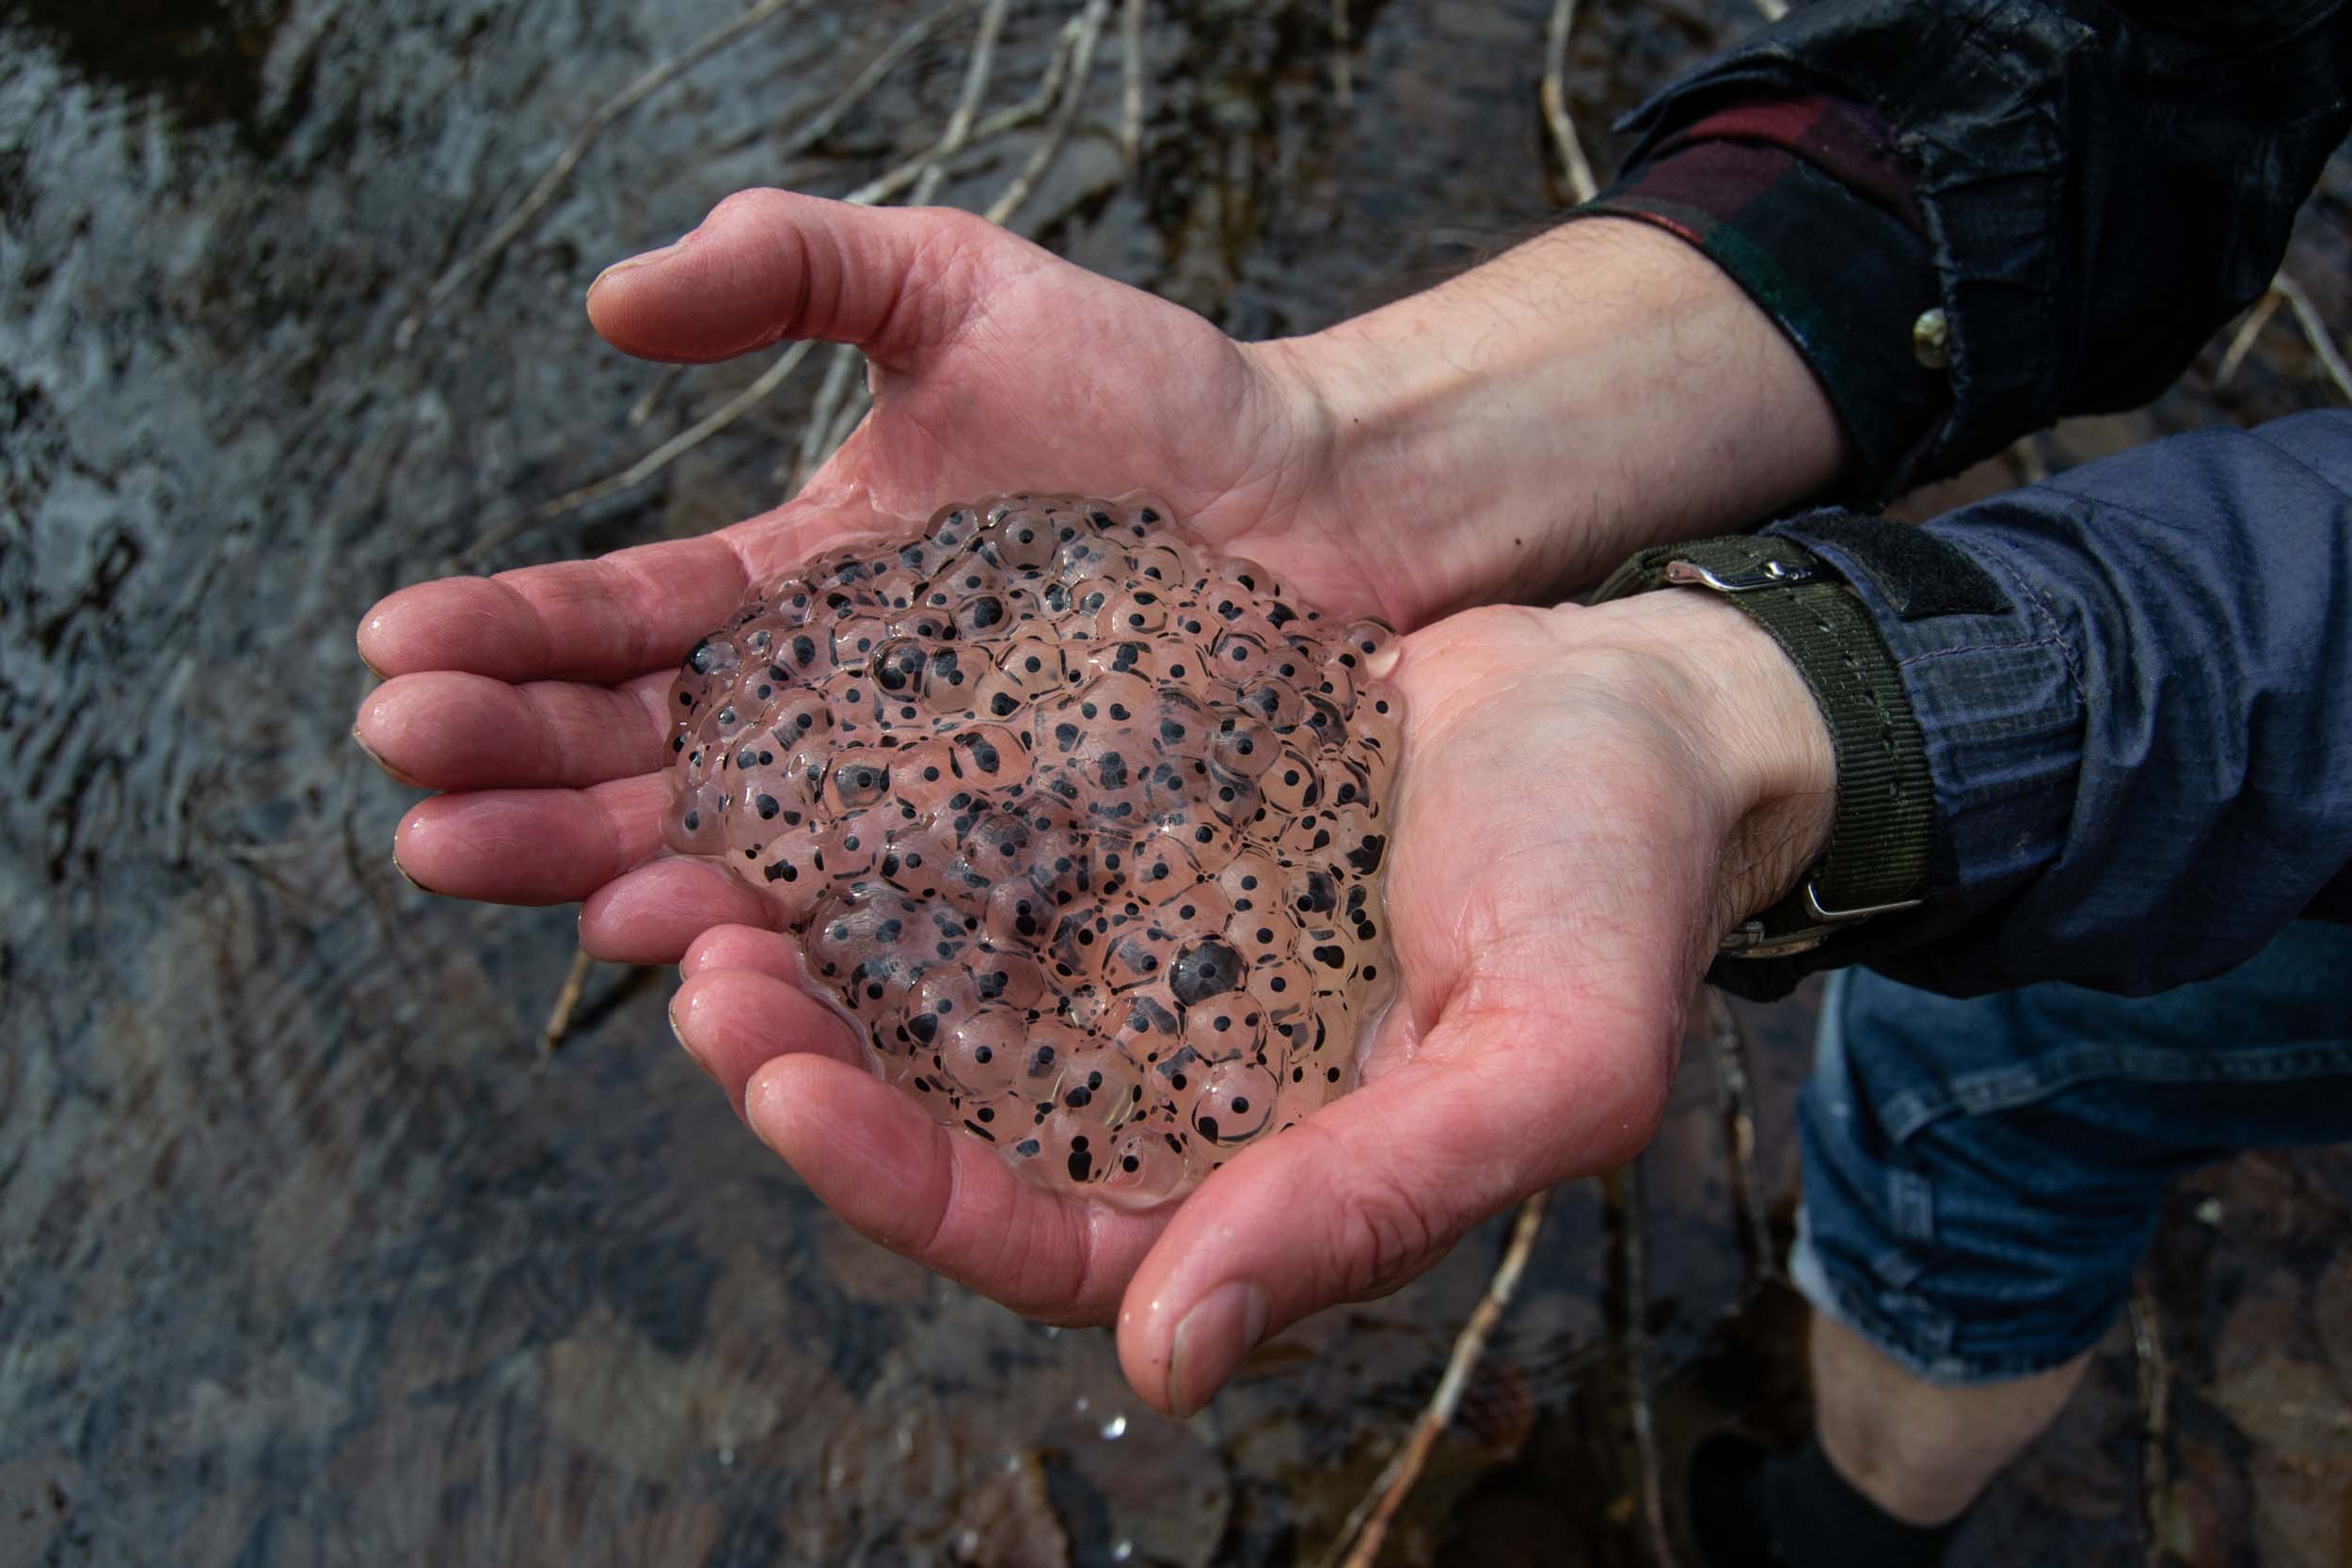
Chris, cool data logger. One of the photos identifies a series of Spotted Salamander eggs as Wood Frog eggs.
Thanks Jim. Most of those looked a little runny so I assumed they were wood frogs. But I guess they were holding together even when lifted out of the water. I will change the caption.