The Fred and Goose Cove study sites at Glacier Bay are only 4.2 km (2.7 miles) apart and the glacier exposed Goose Cove only about a decade earlier than Fred. The vegetation development at Goose Cove during the two decades after I established the plots (ca. 1990-2010) should be comparable to the most recent two decades of development at Fred (ca. 2000-2020). Precise comparisons require that I know how old the two sites are.
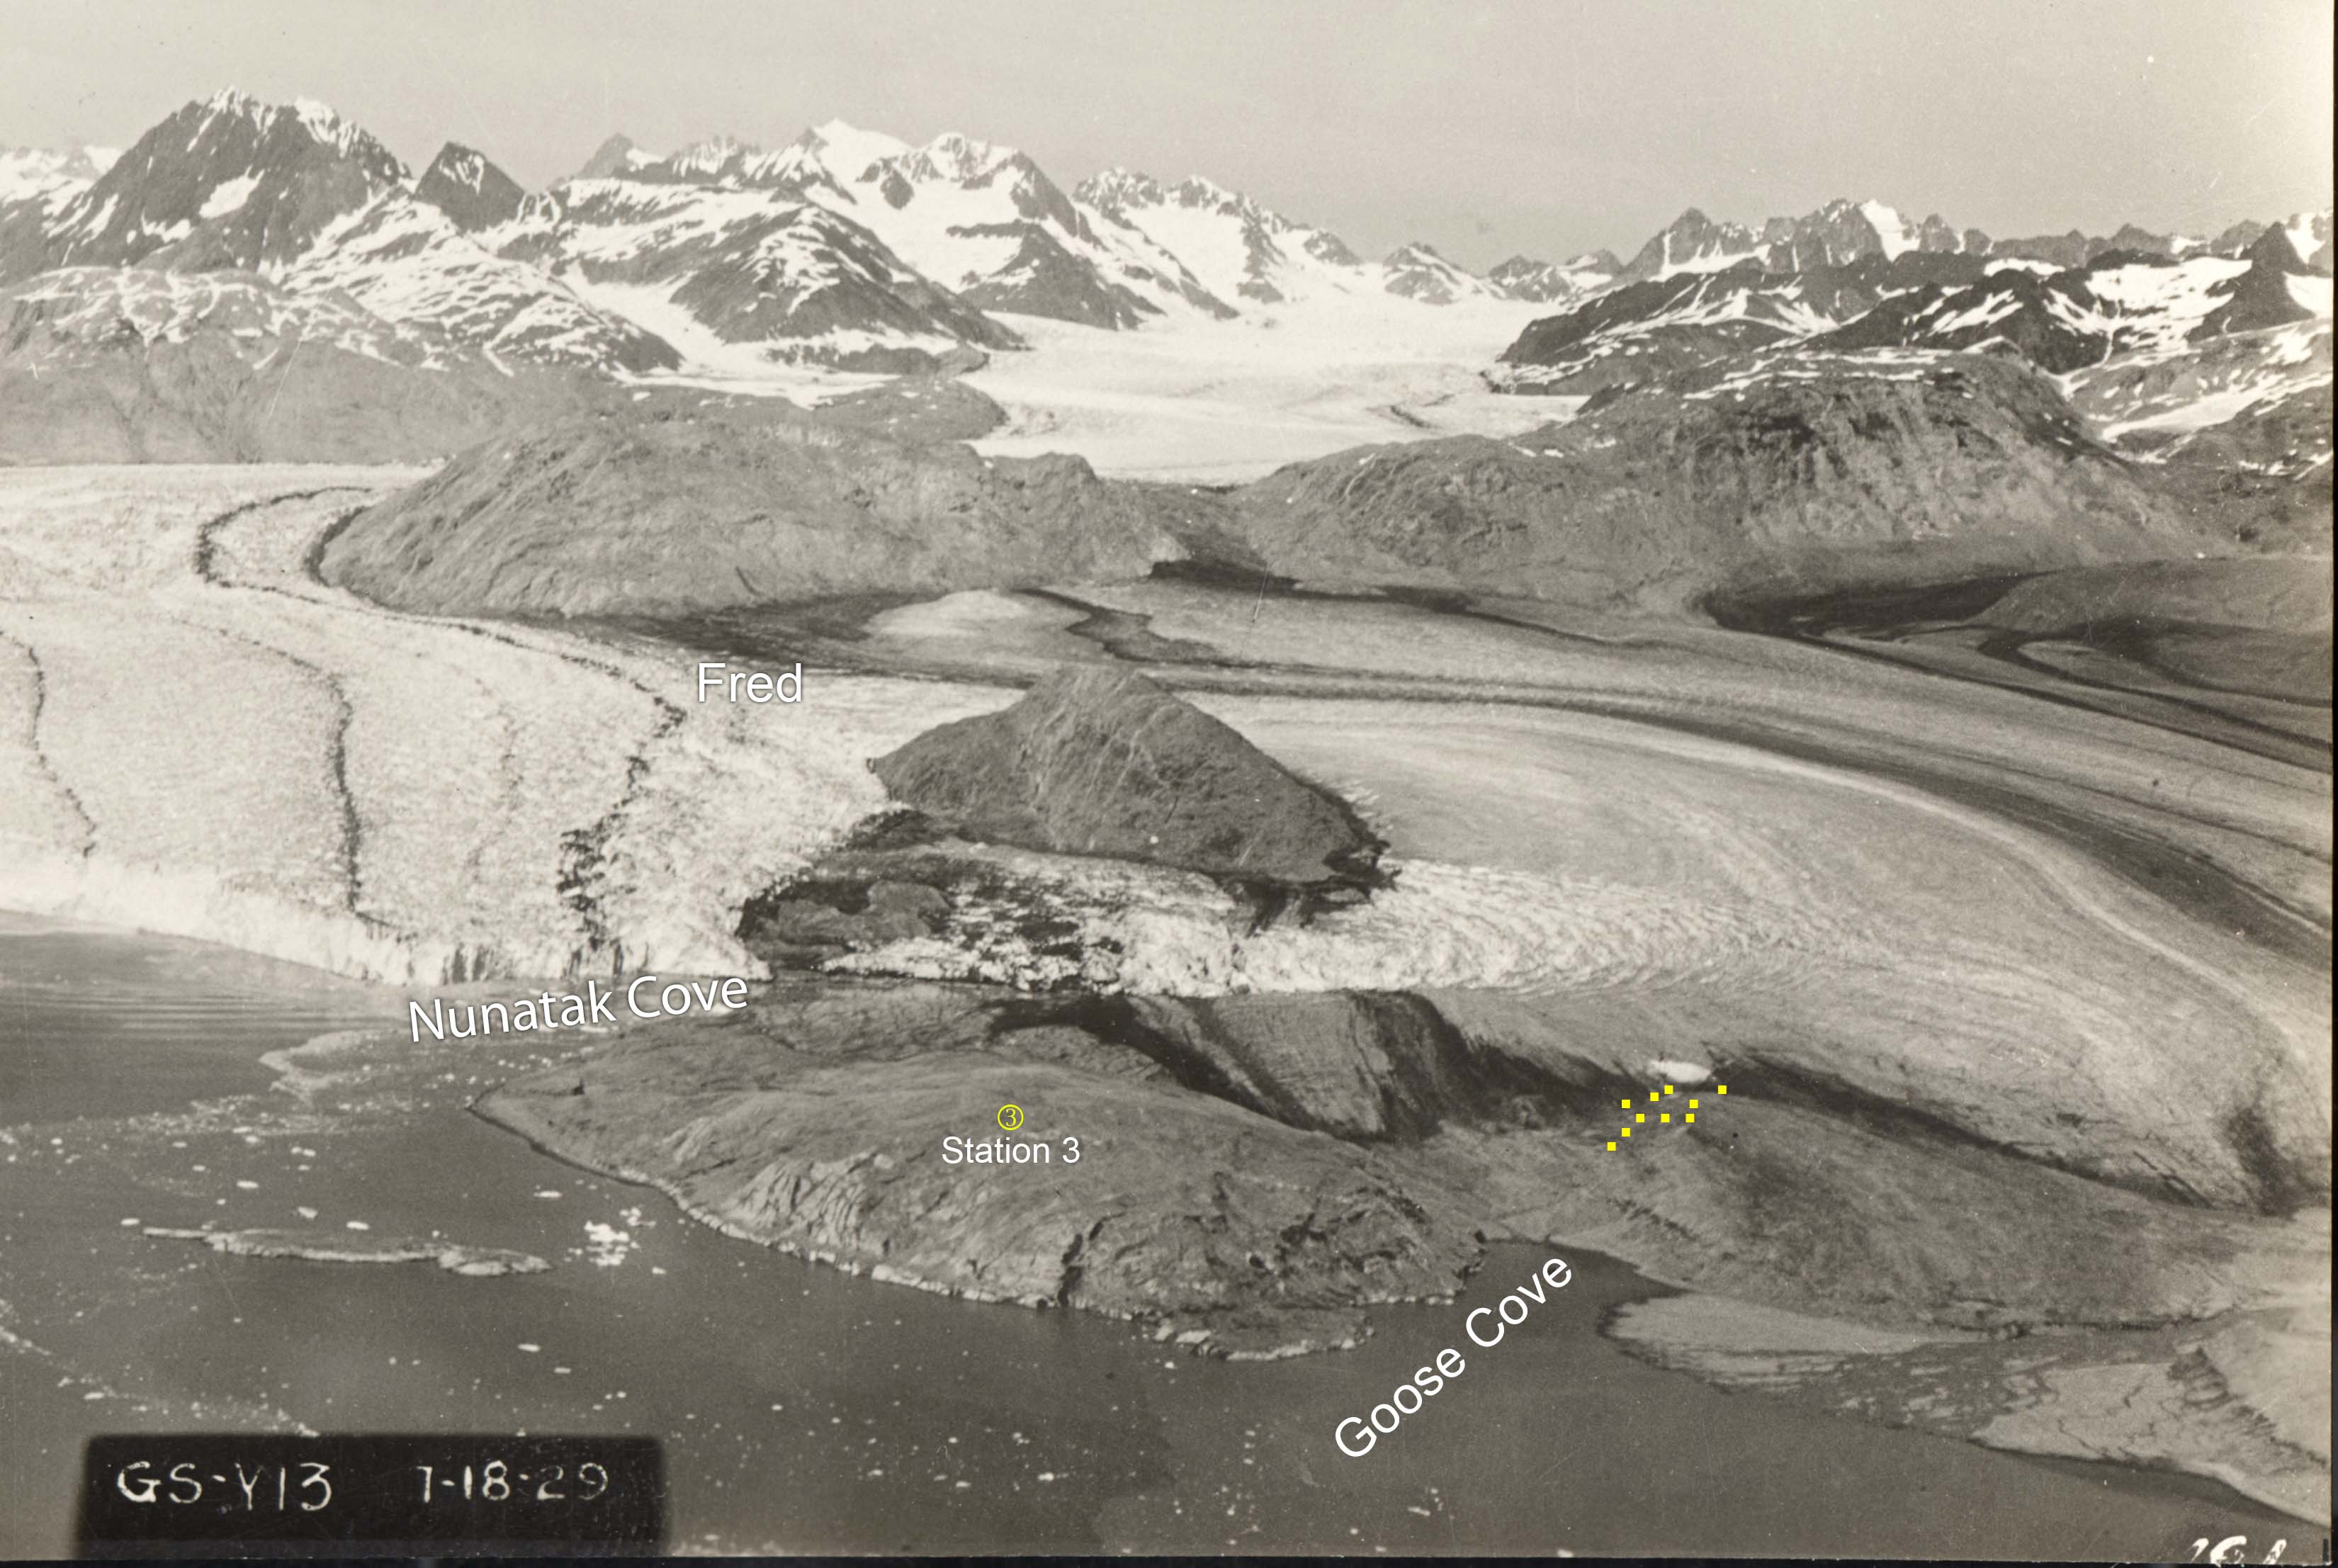
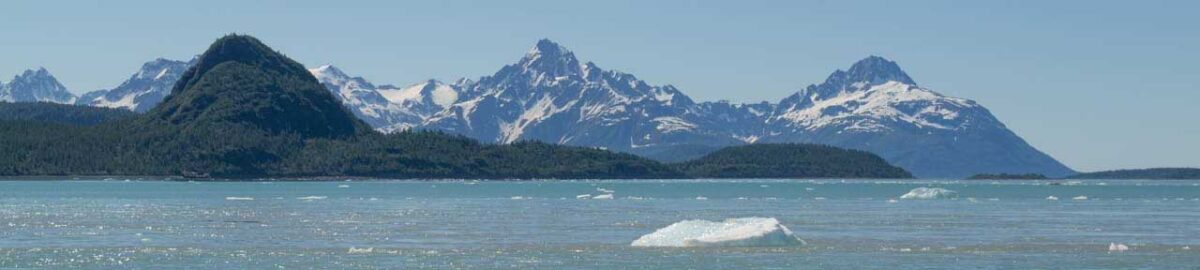
It is not possible to precisely pinpoint my study plots on these oblique aerial photos, so the locations of the plots in Figures 1 and 2 are approximate. One or more plots could have been under the ice in 1929, but probably no more than four plots. So 1929 might be a good date for the exposure of at least half of the Goose Cove plots. I had been using the year 1934 for complete exposure of the site and that is probably three or four years too late.
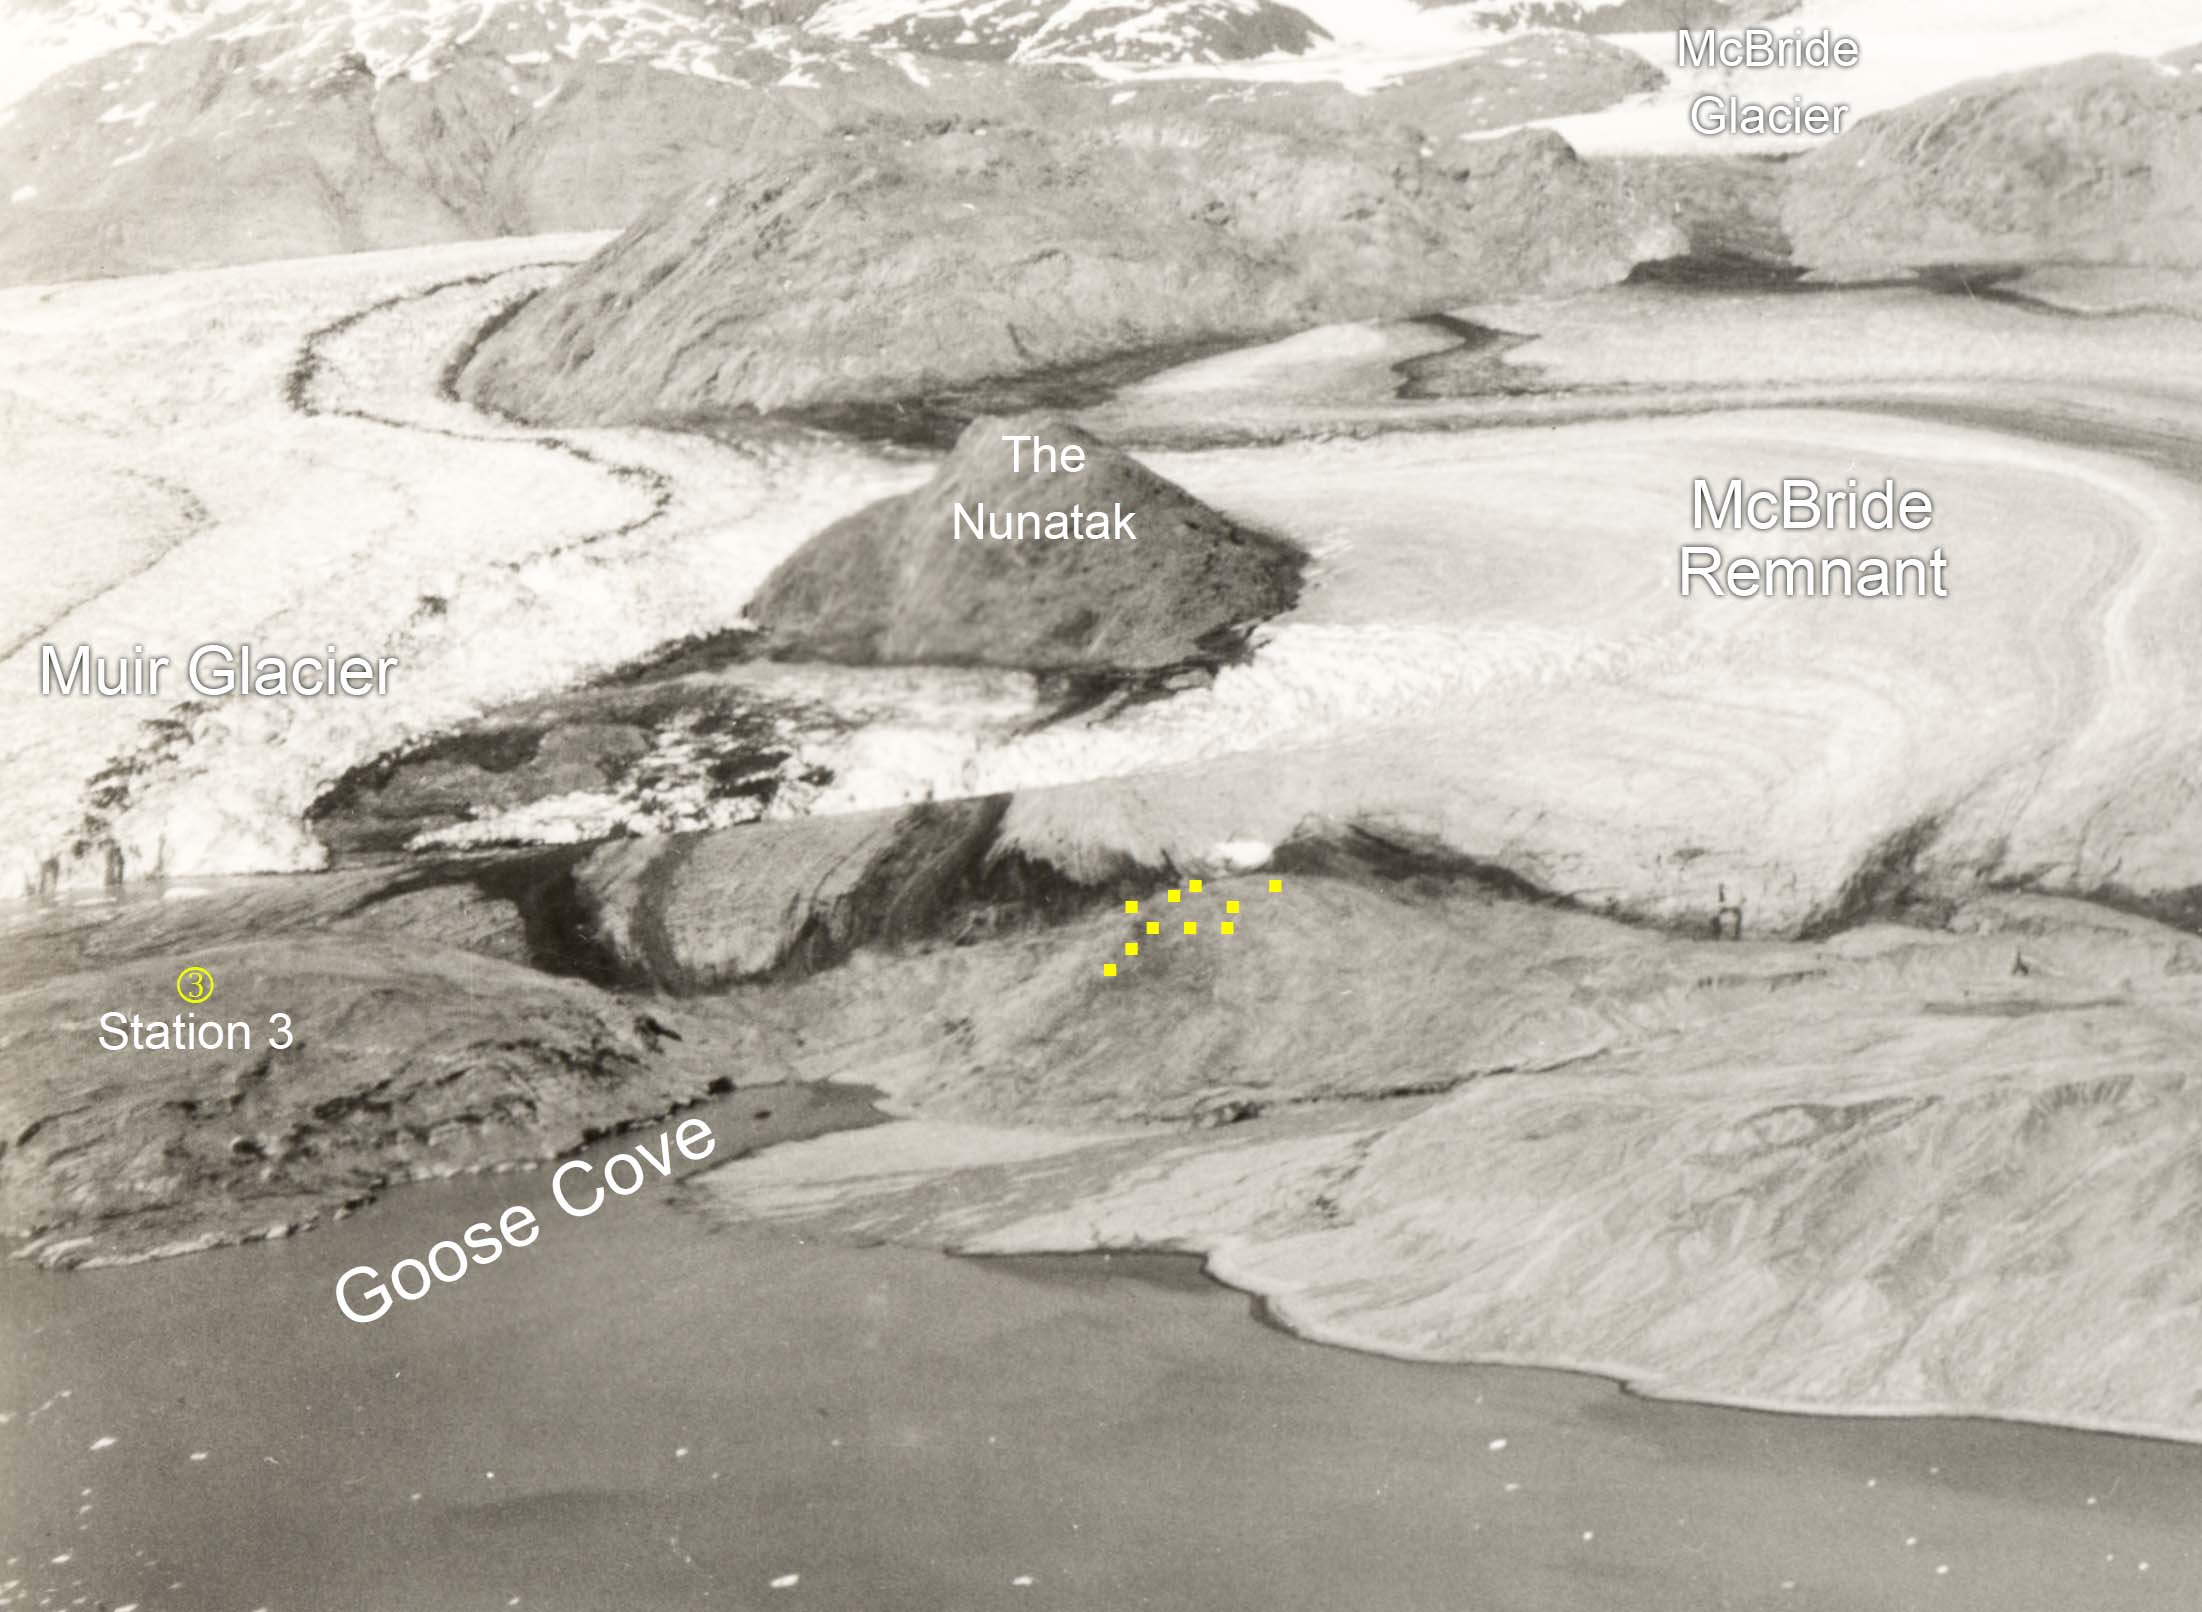
The earliest photo I have found from William O. Field’s Station 3 was taken in 1941. There might be earlier photos from that general location. One scene that Field captured in both 1941 and 1950 includes the area of many or most of the Goose Cove study plots (Figure 3).
In 1950, two decades after the surface had been exposed from under the ice, little vegetation at the study site is conspicuous from a distance, although Dryas, low willows, and scattered alders were probably present. The rapid expansion of alder cover nearby between 1941 and 1950 (Figure 3) suggests that a decade later, alder probably covered the Goose Cove study plots.
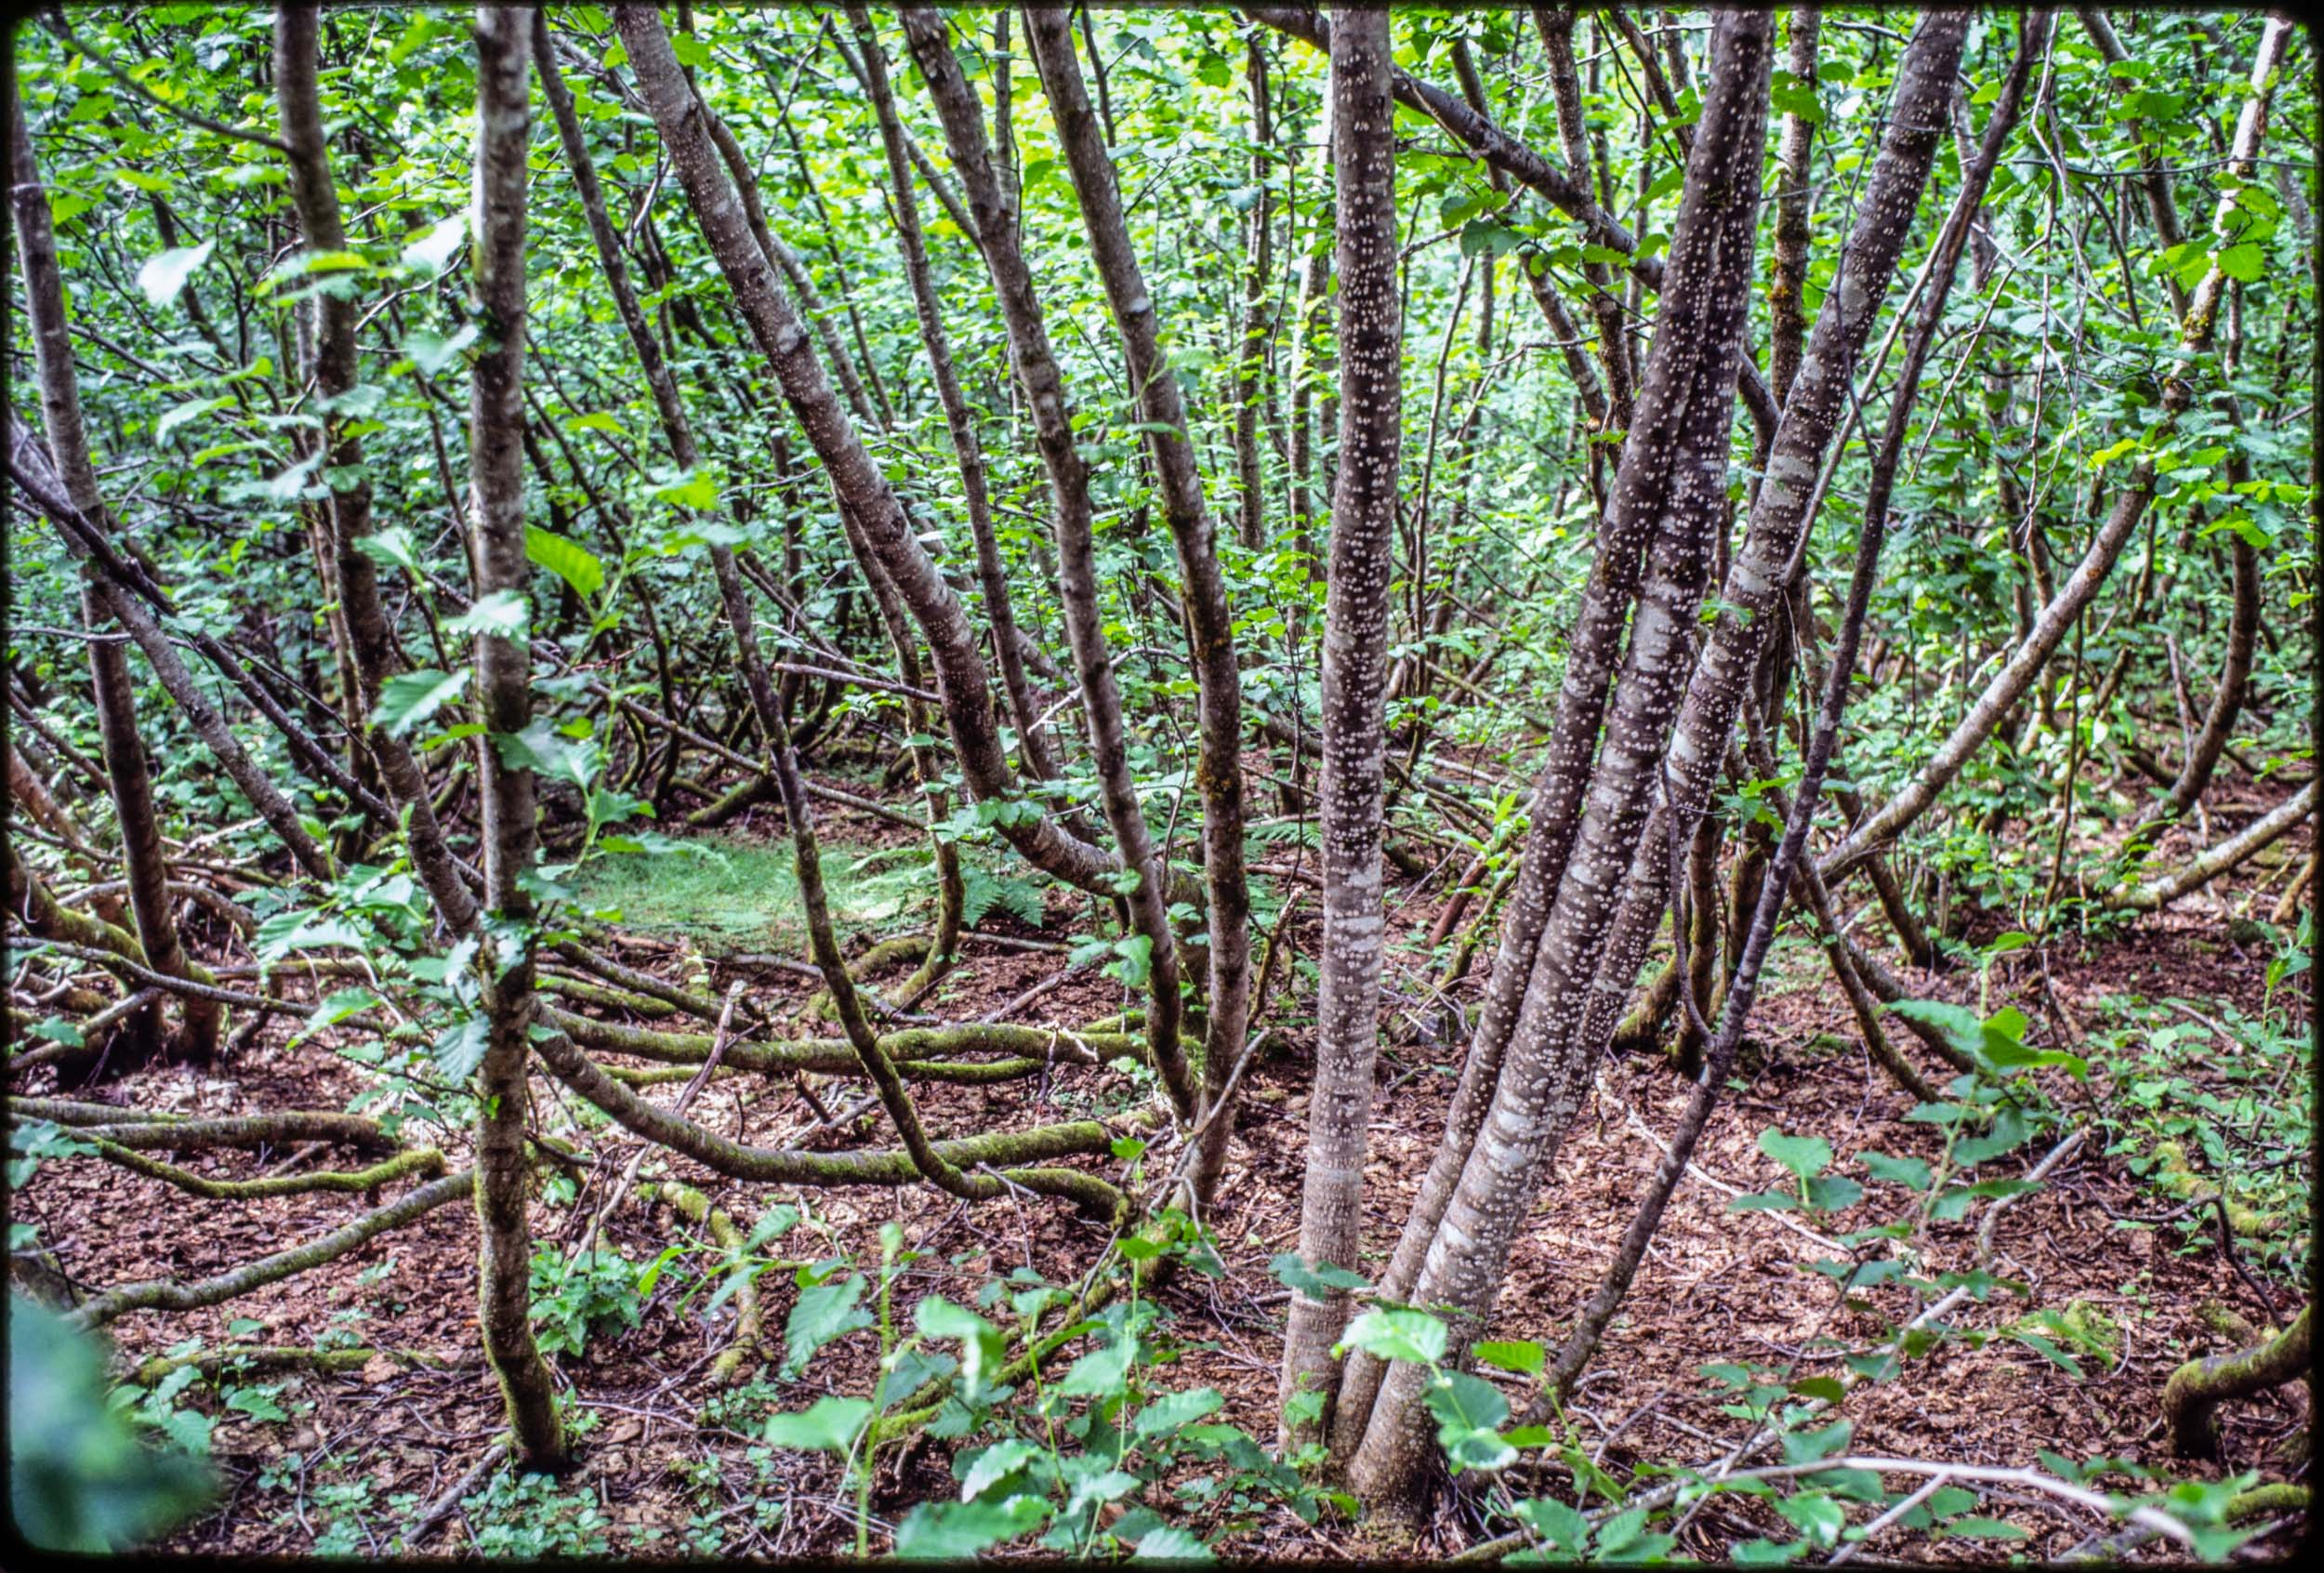
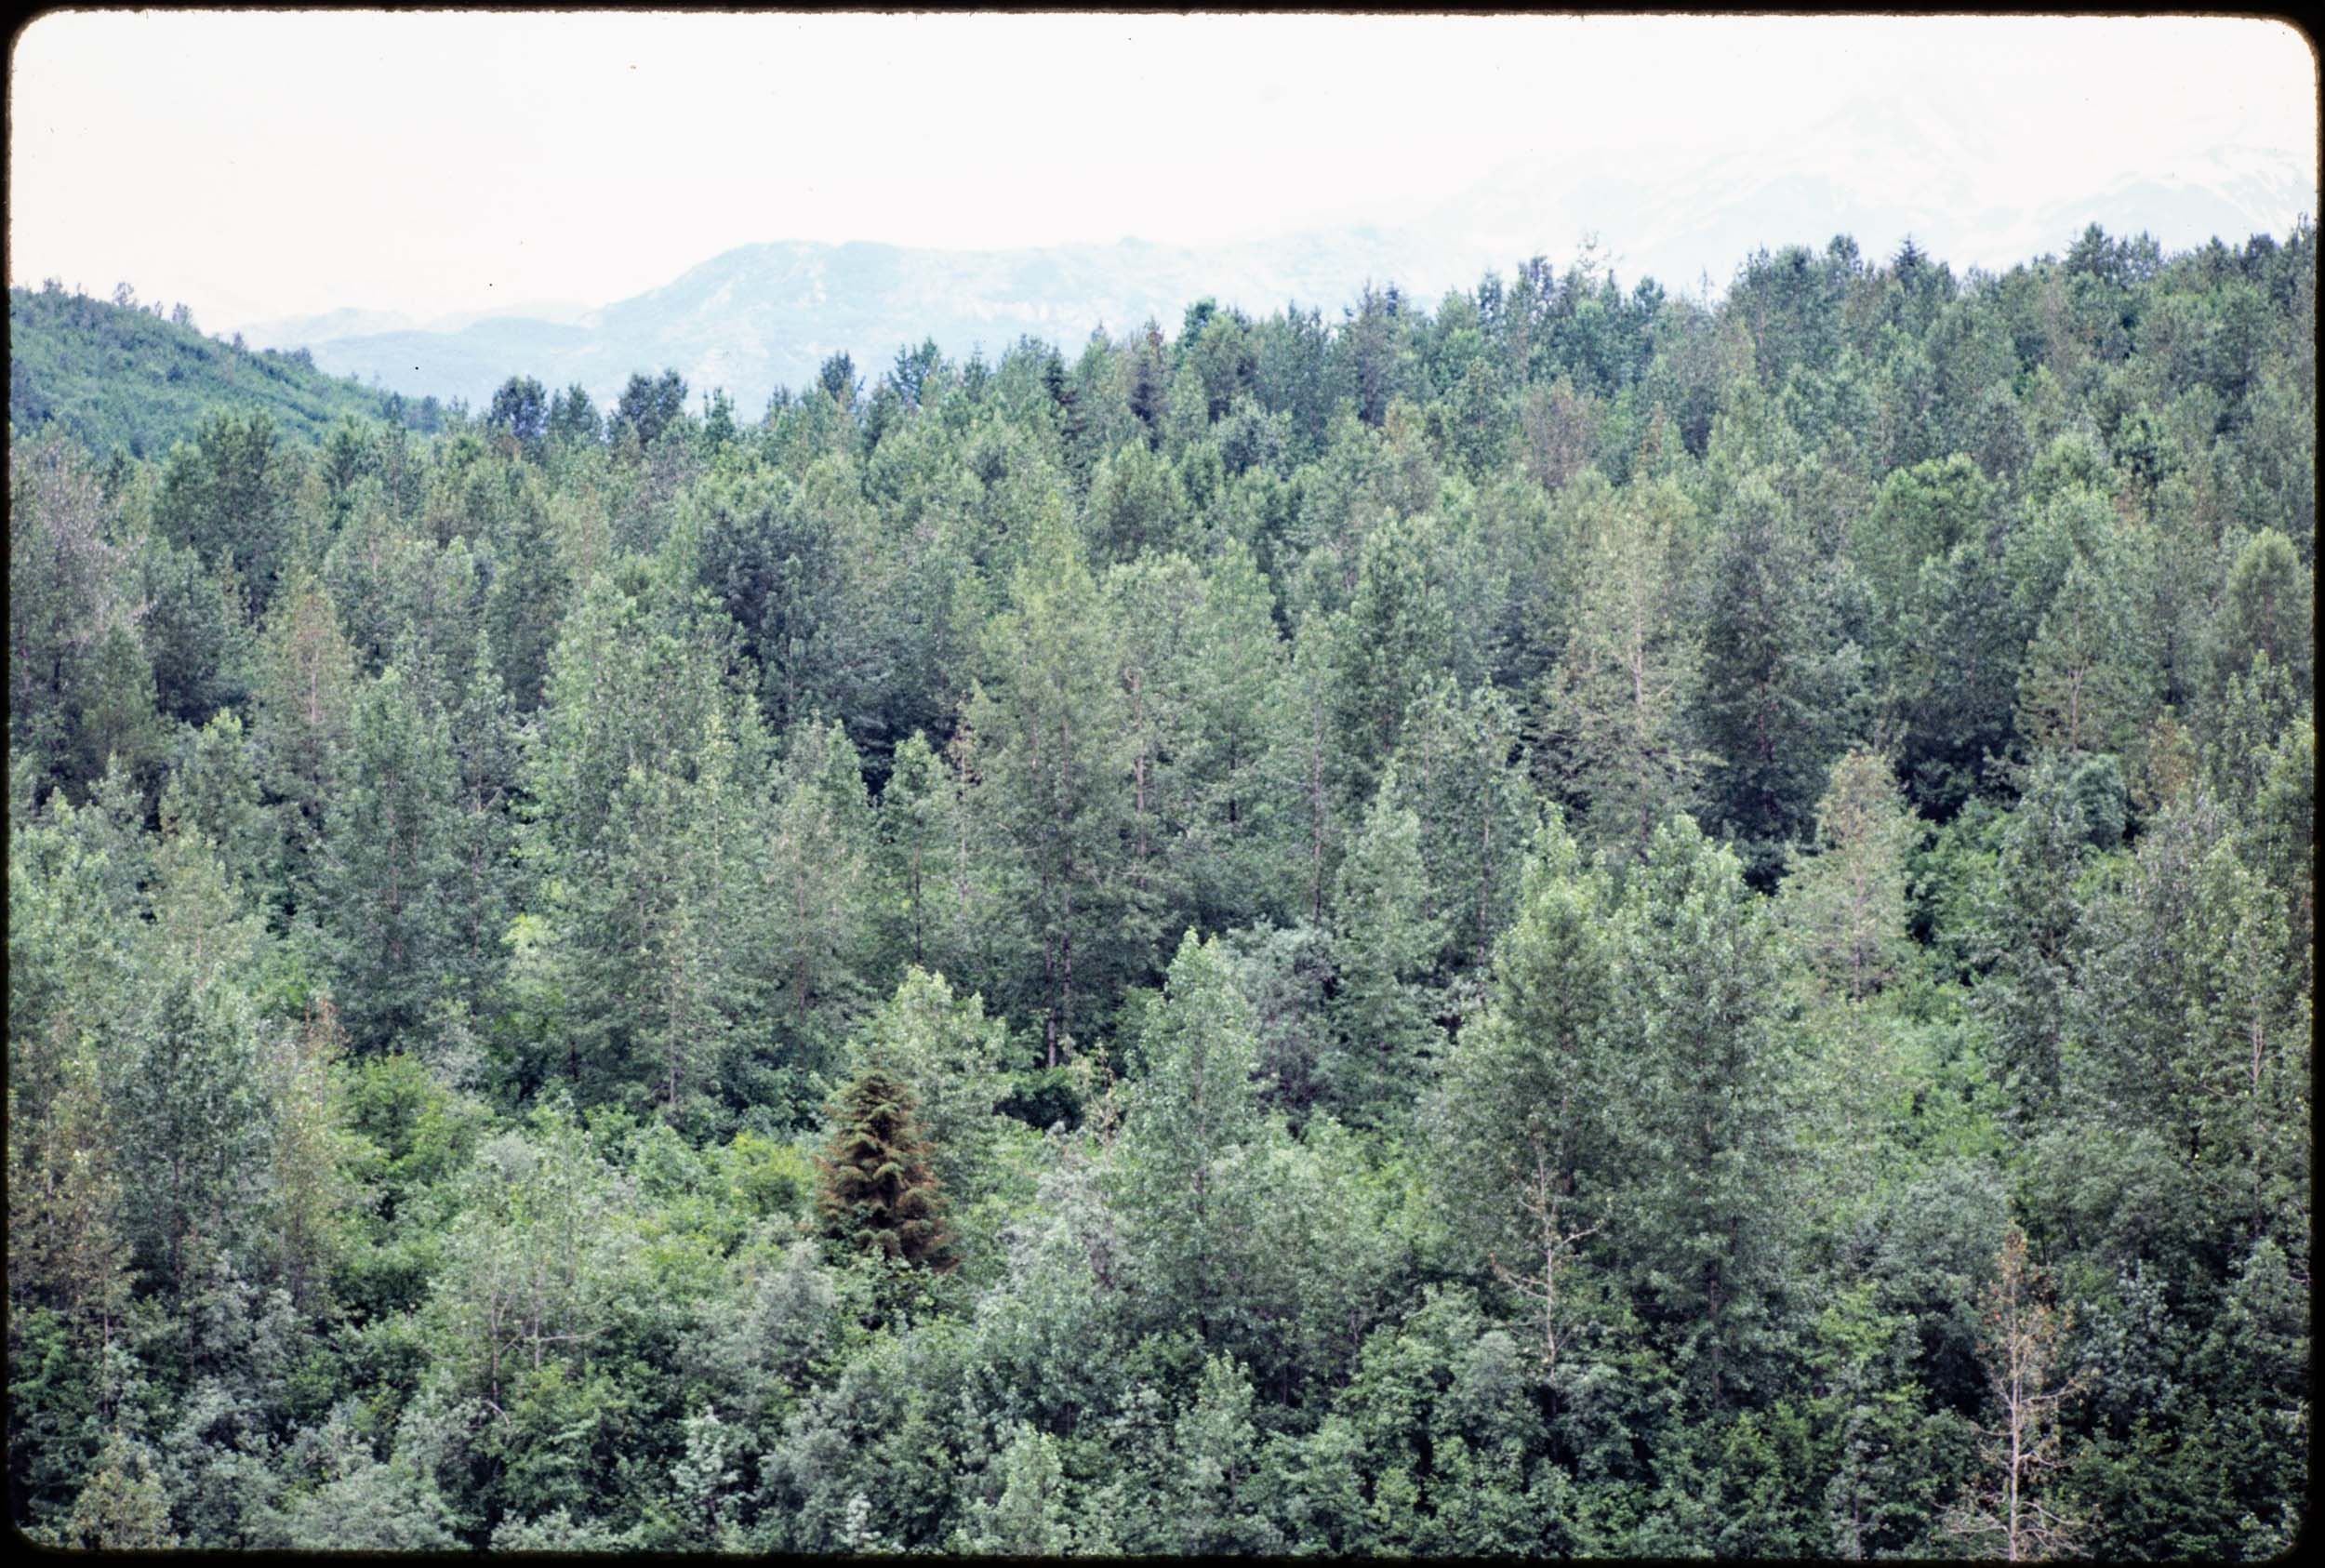
In 1988, there were 30 shrubs and 120 shrub stems in each plot (each 10x15m, so 8000 shrub stems/ha). Most of the shrubs were alder (Figure 4) and about 5% were willow. There were also three or four cottonwood trees in each plot, so from above the site looked like a cottonwood forest (Figure 5) but 70% of the biomass was alder.
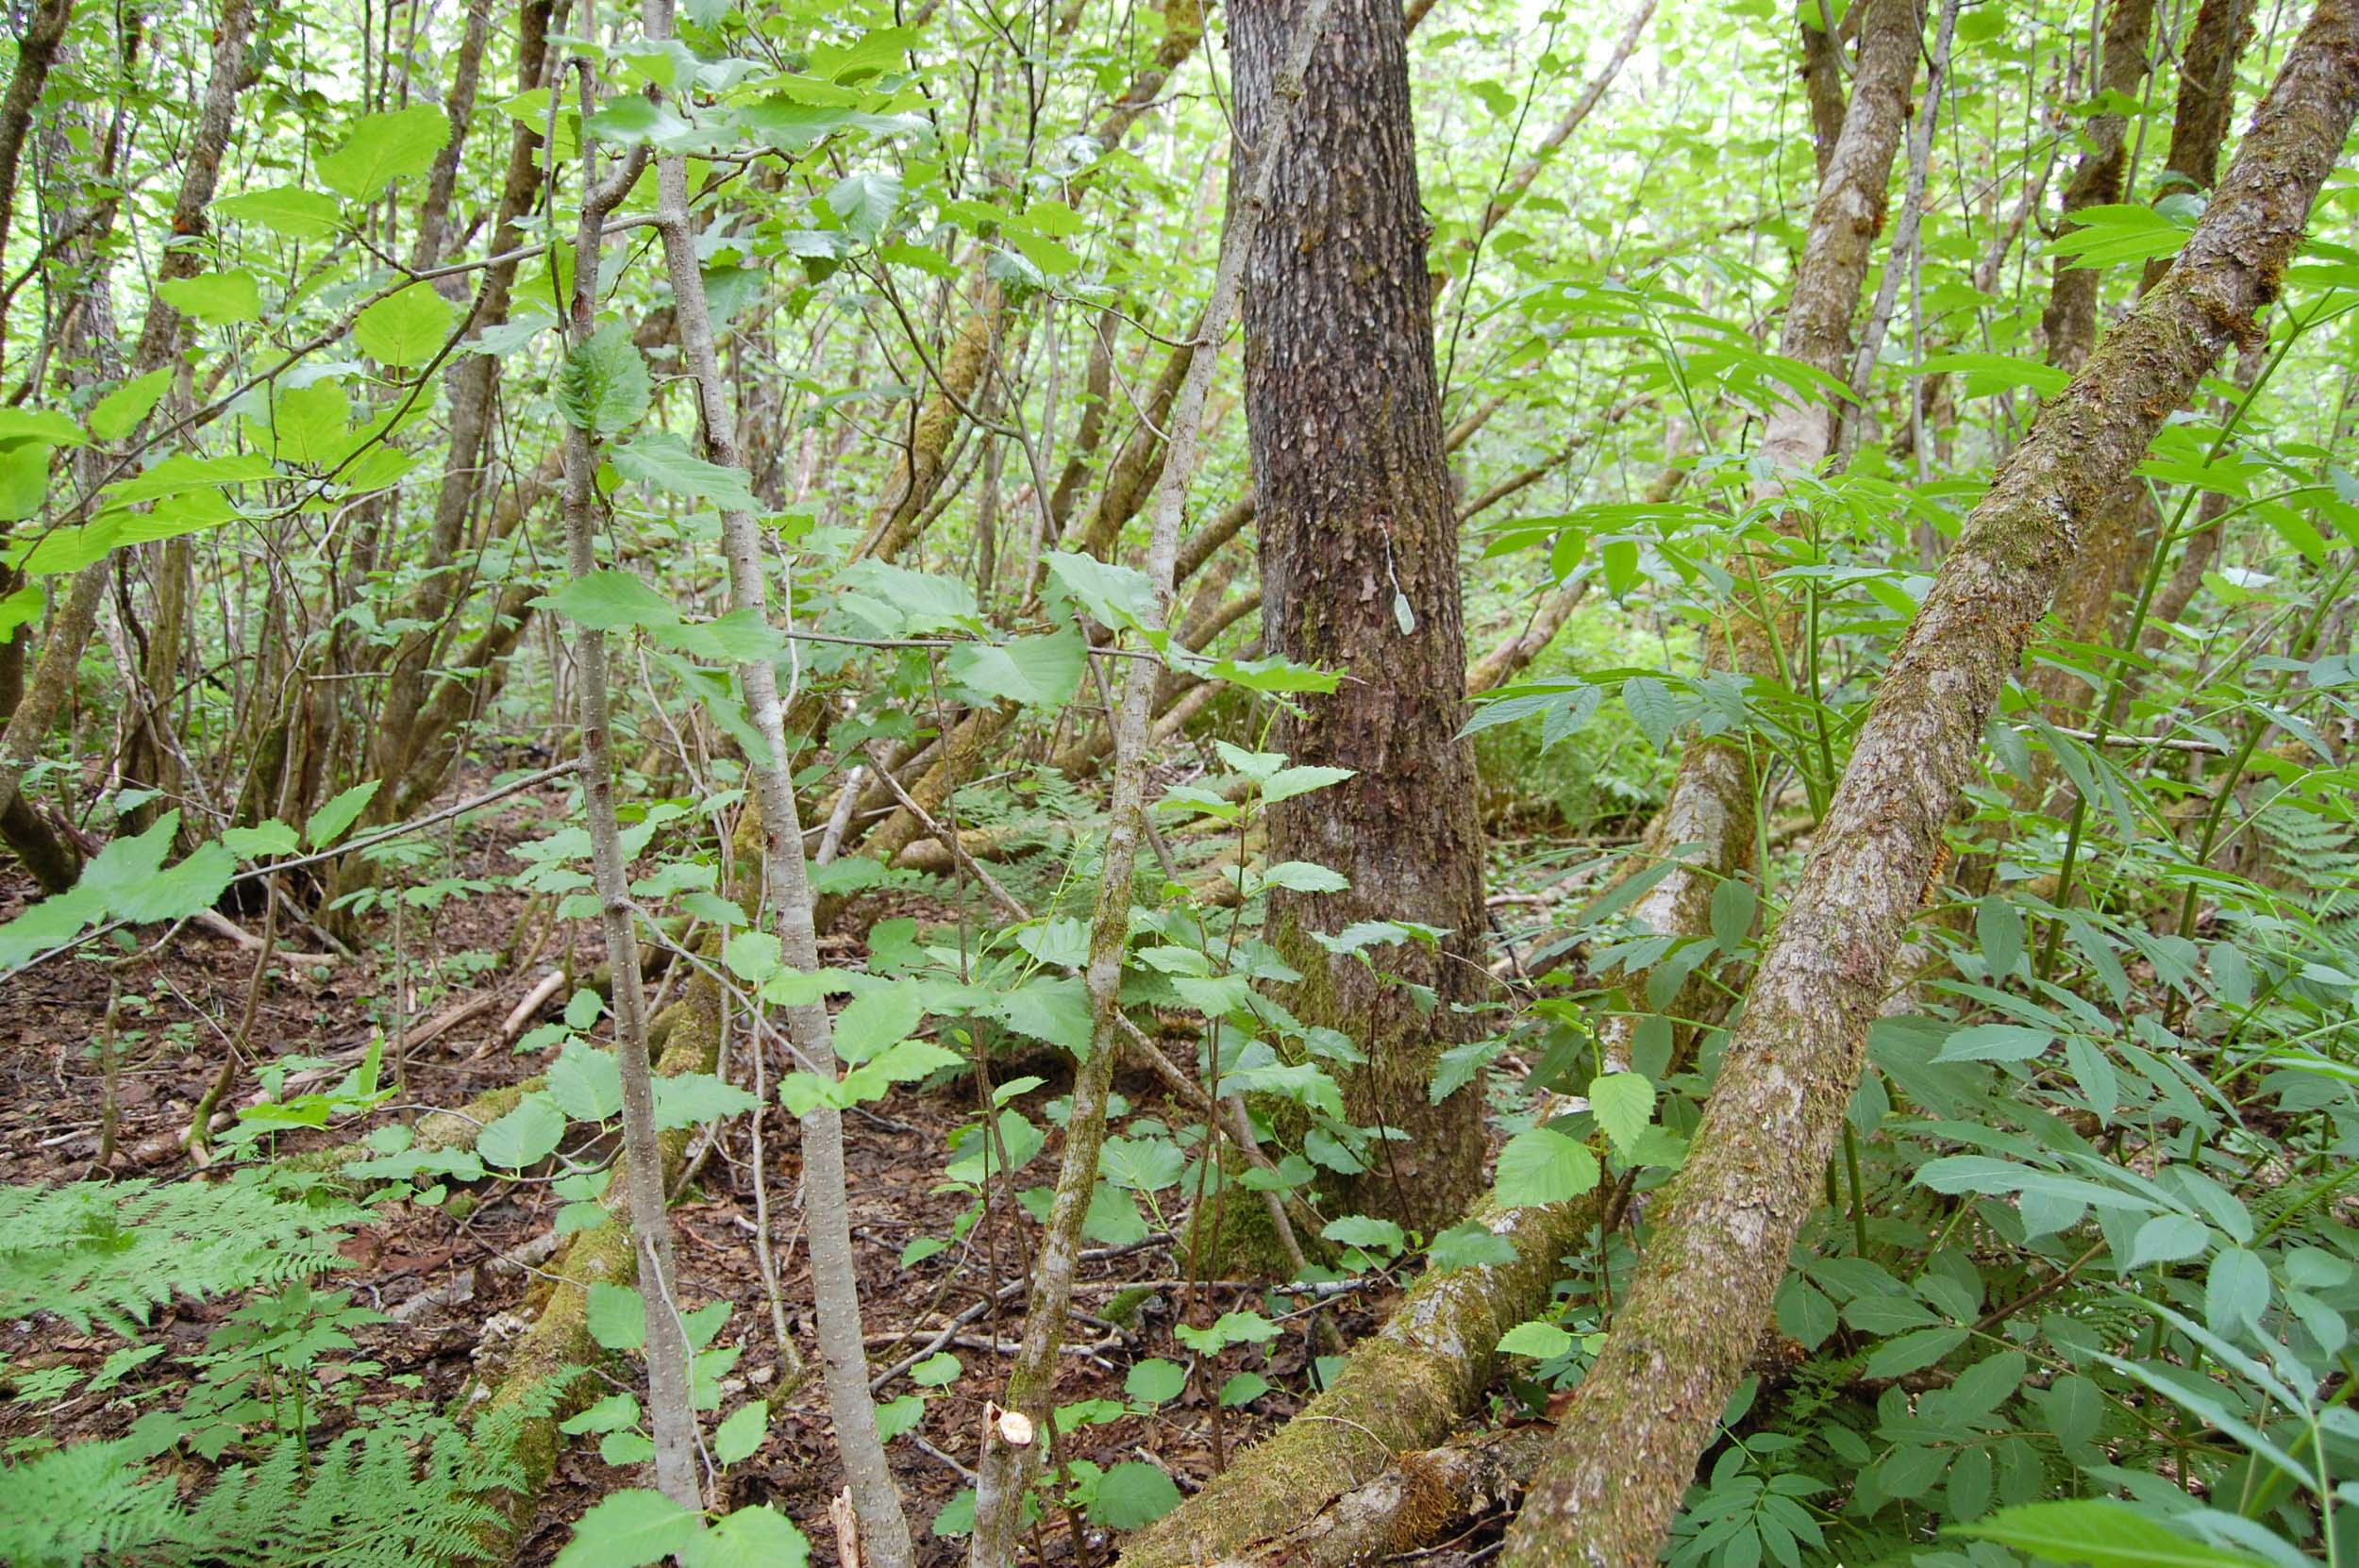
By 2007, a third of the shrub plants and half of the shrub stems had died and there were still about the same number of cottonwood trees (Figure 6). In 2021 (Figure 7) the basal area of cottonwood trees had tripled compared to 1988, and alders continued to decline.

Alder has been fixing atmospheric nitrogen and producing N-rich litter and fine roots for six decades at Goose Cove. There has been, or will be, similar long-term importance of alder at most lowland sites in Muir Inlet south of Riggs Glacier and as far south as Sandy Cove and Geikie Inlet. Alder, and its soil-enriching properties, have not been so important farther south in the bay or most places north of Hugh Miller Inlet in the west arm of Glacier Bay. Alder was probably preempted at most of those places by other species which were able to get there first for one reason or another. The disparity between long-term importance vs. trivial presence of alder is expected to be associated with critical differences in successional development at the level of populations, communities, and the ecosystem.
There’s some weird stuff going on with those 1929 photos – it almost looks like they’ve been stitched. What’s up with that “hanging” ice edge a third of the way up the side of the Nunatak…?
The apparent seam in the 1929 air photos (Figs. 1 and 2) is the primary reason I included both of those photos. By comparing them you can discern that the seam is an ice surface. There is a smooth surface on the stagnant ice draped over the ridge between Nunatak Cove and Goose Cove. That surface creates an ice horizon that forms the straight “seam.”
It appears that in 1929 there were many meters of ice on top the Fred study site (Figure 1). All of that ice was gone 12 years later. That suggests that one year is probably all it takes to expose all 10 of the plots at a study site.
Chris, this is fascinating, and a tribute to what can be derived from very careful photo analysis and simple but carefully collected stem counts and measurements. You and your data continue to tell a really important story.