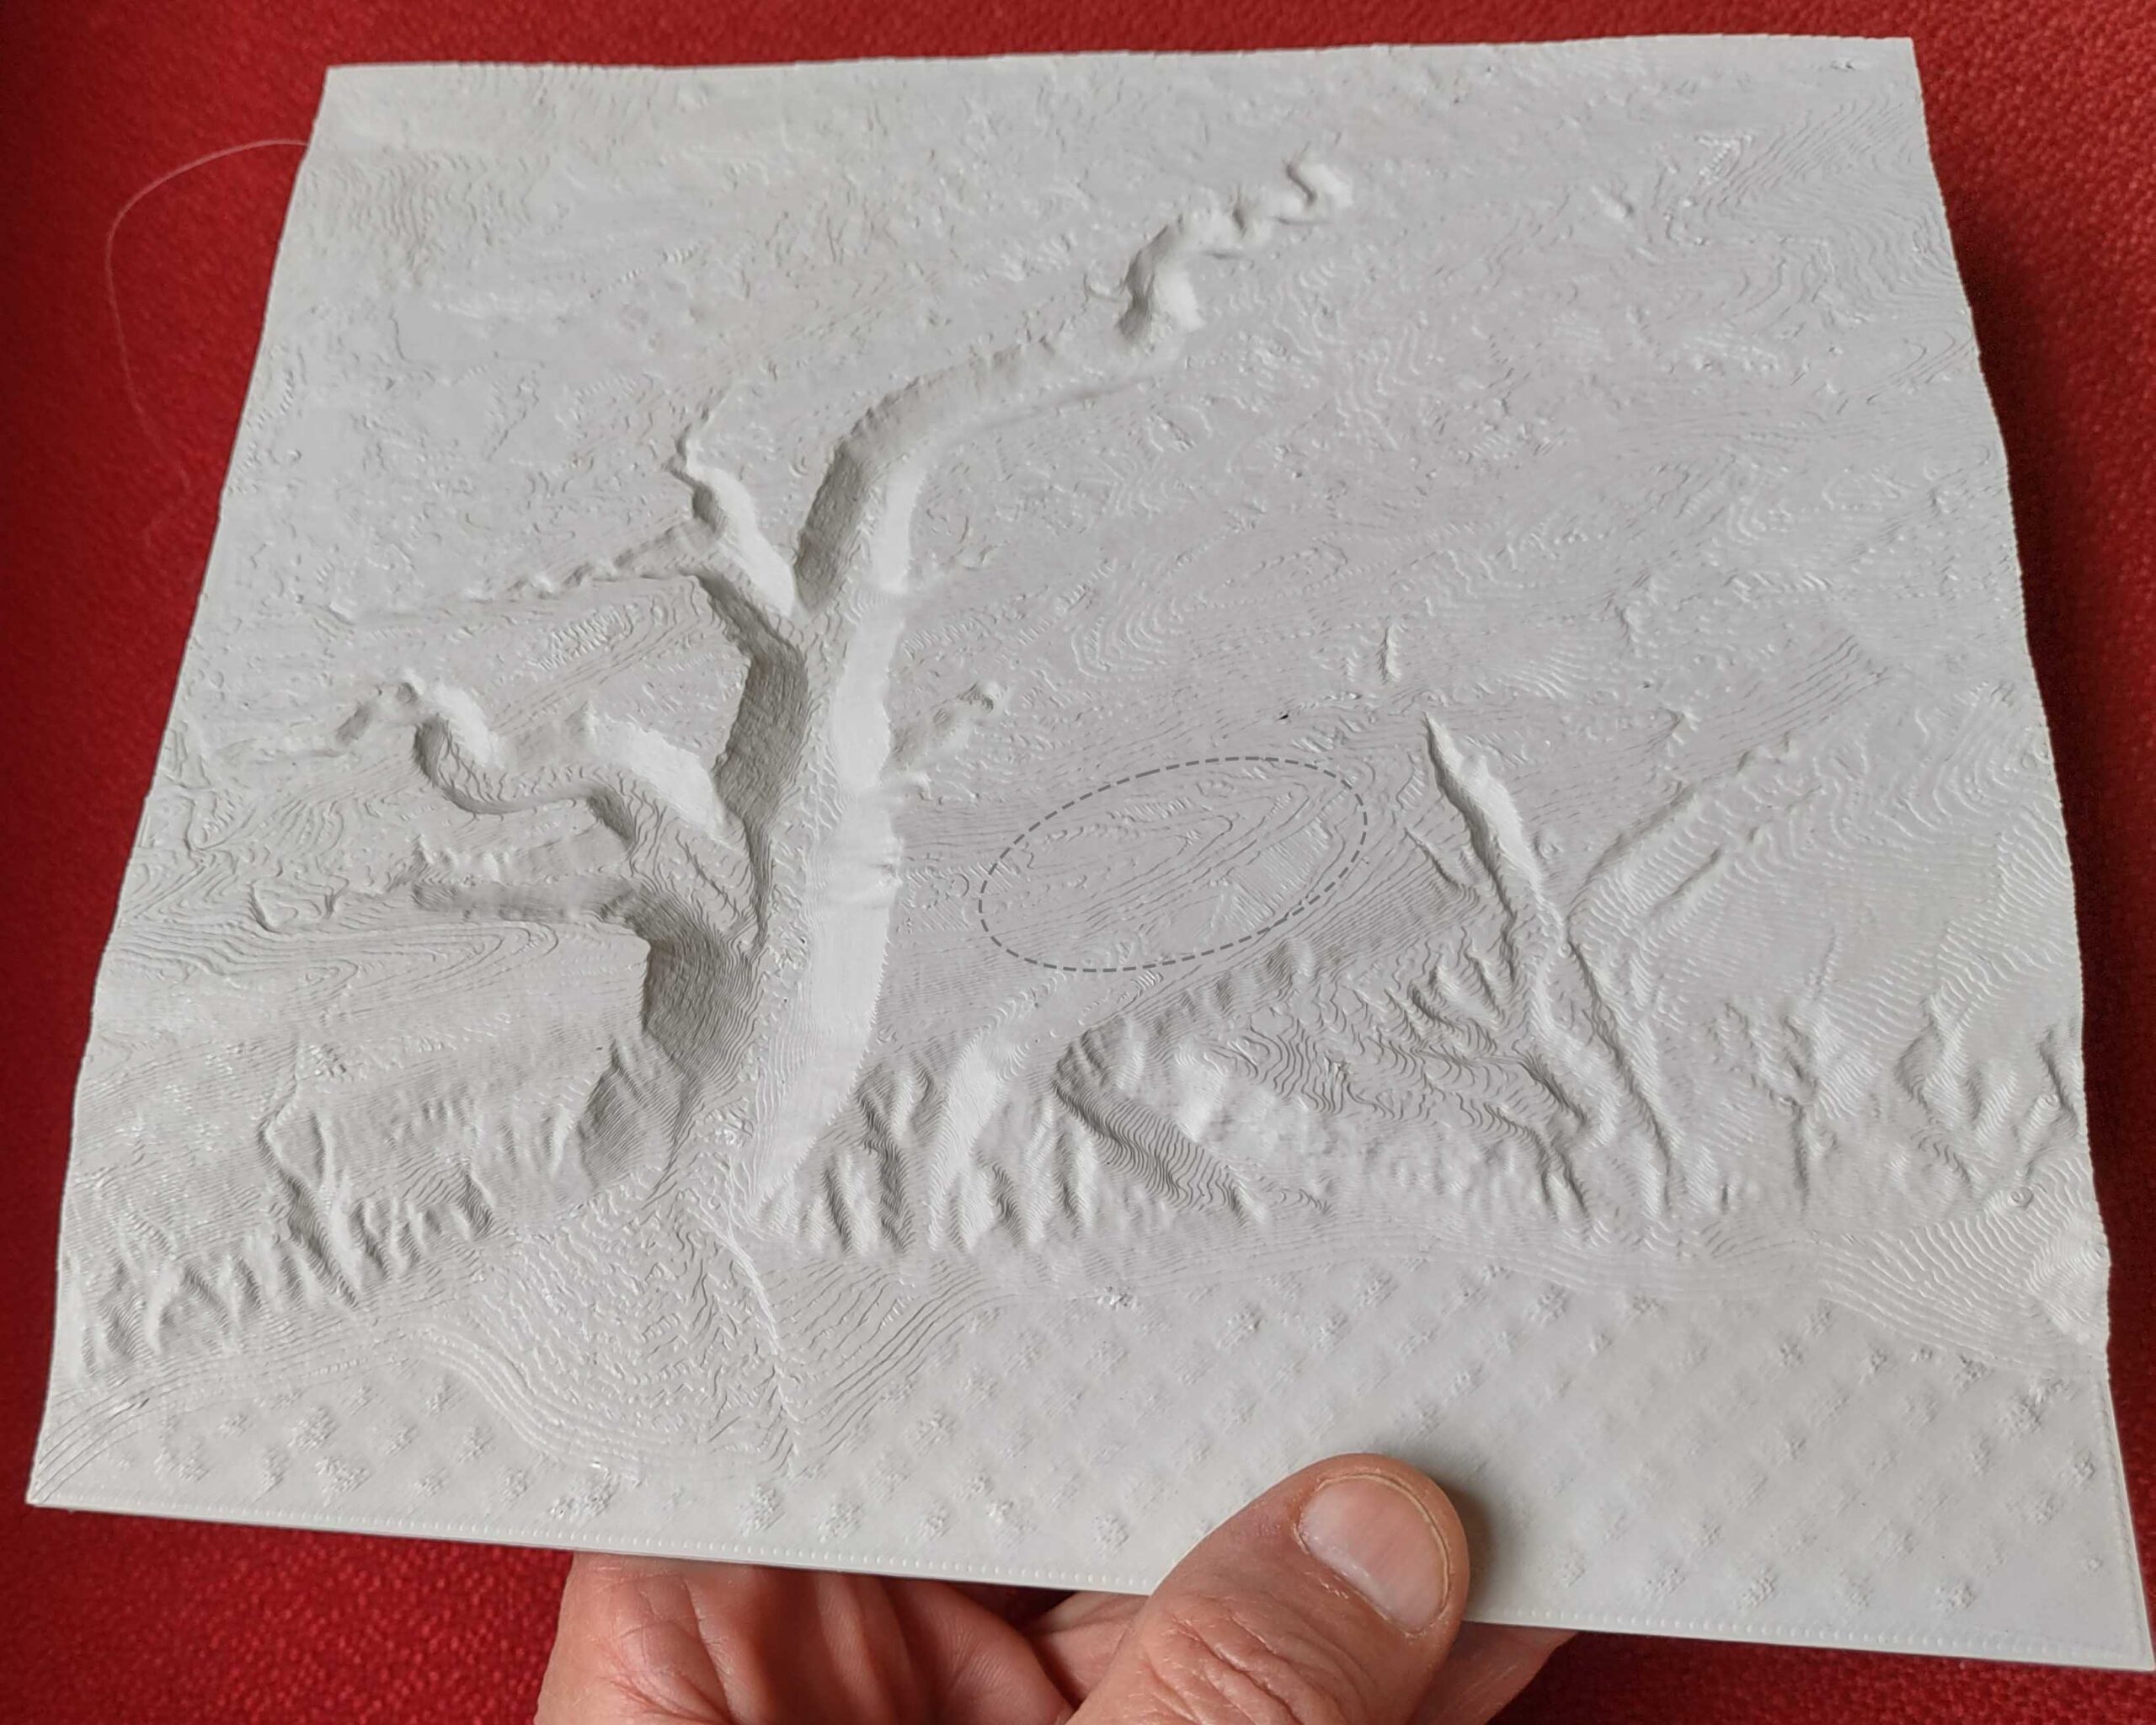
LiDAR datasets allow us to work with digital facsimiles of the earth surface and its adornments (e.g., vegetation). It’s also possible to transform the digital models back into physical form. I have been trying this with my 3D printer.
At the end, I am at home in the woods
LiDAR datasets allow us to work with digital facsimiles of the earth surface and its adornments (e.g., vegetation). It’s also possible to transform the digital models back into physical form. I have been trying this with my 3D printer.
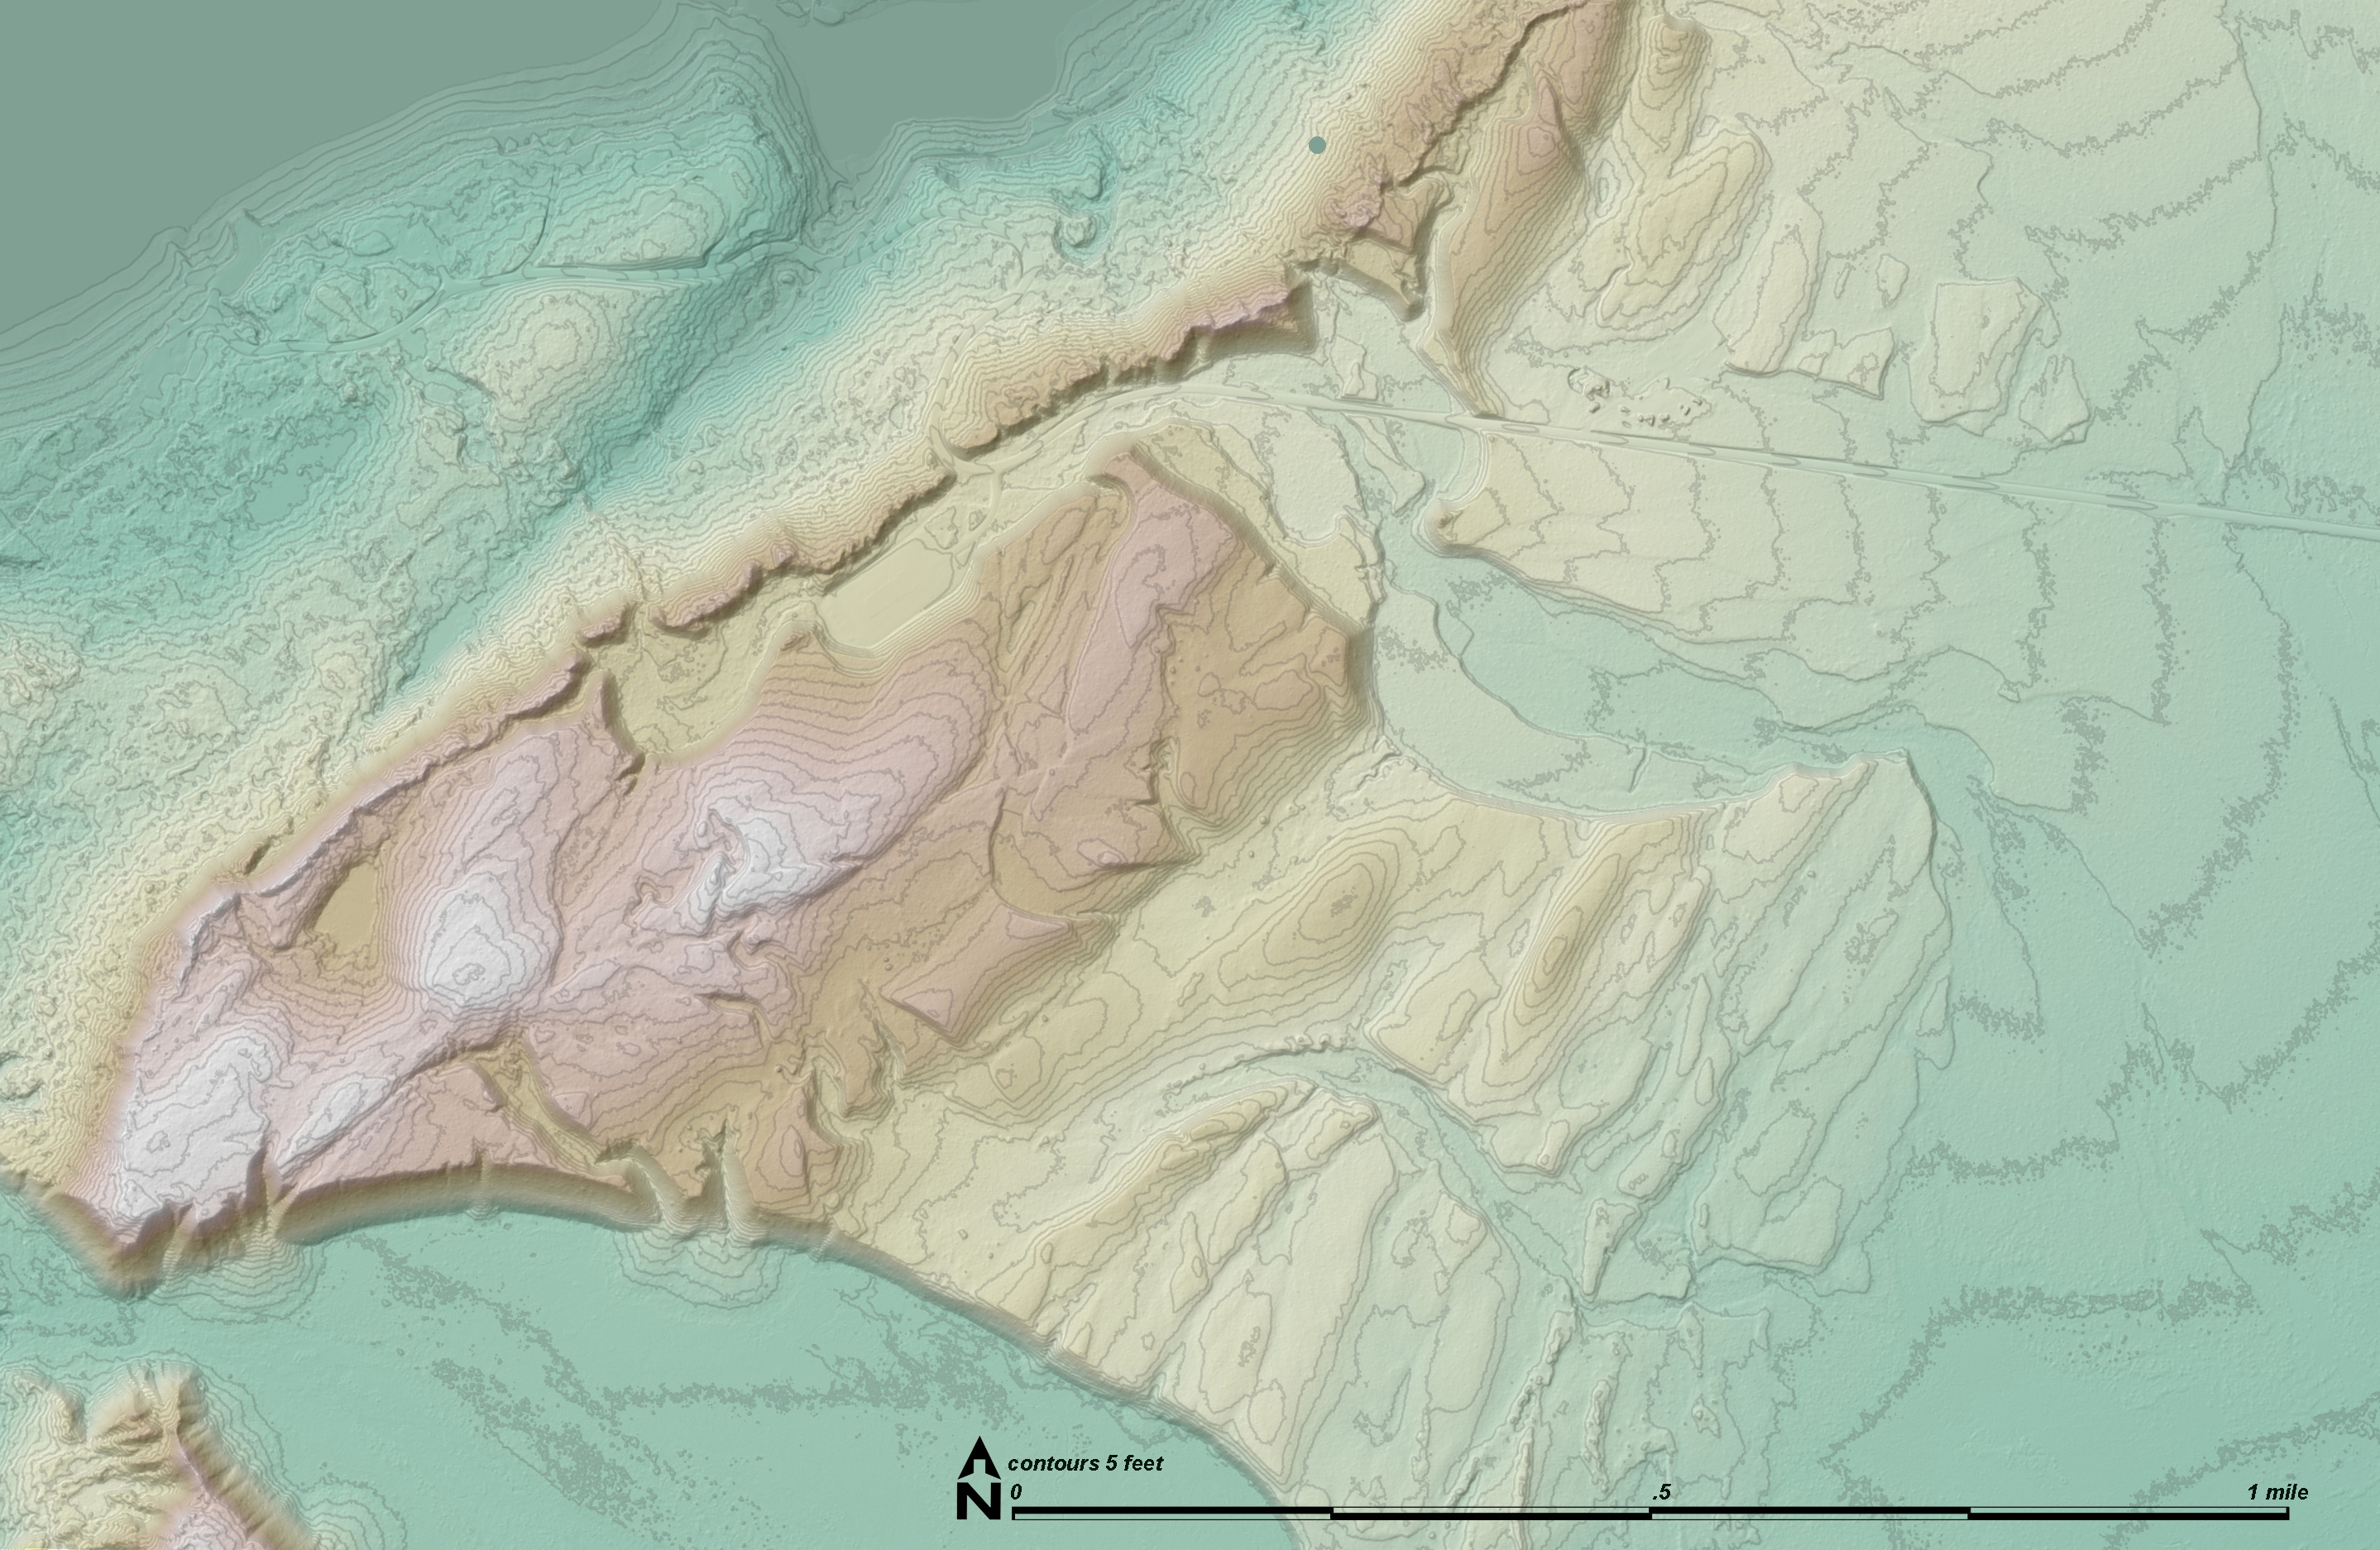
The new LiDAR dataset for Glacier Bay includes not only the “bare earth” digital terrain model but also the point cloud which can represent vegetation and other things the airplane-borne LiDAR bounced off first before it bounced off the ground. This “first returns” cloud can show the shape of the upper vegetation canopy and even distinct understory strata. I have been trying to determine if any useful information can be quantified from the point cloud and to use QGIS to make colorful 3D images of the canopy models.

In 2019 Glacier Bay National Park paid to have LIDAR mapping data collected for about a third of the park. Last summer the processed data were delivered and have now started to appear online for downloading. Most of the data are good quality (6.14 points/meter²) and the area around Park Headquarters and two areas of the outer coast (Pacific coast) are better quality (16.52 points/meter²).
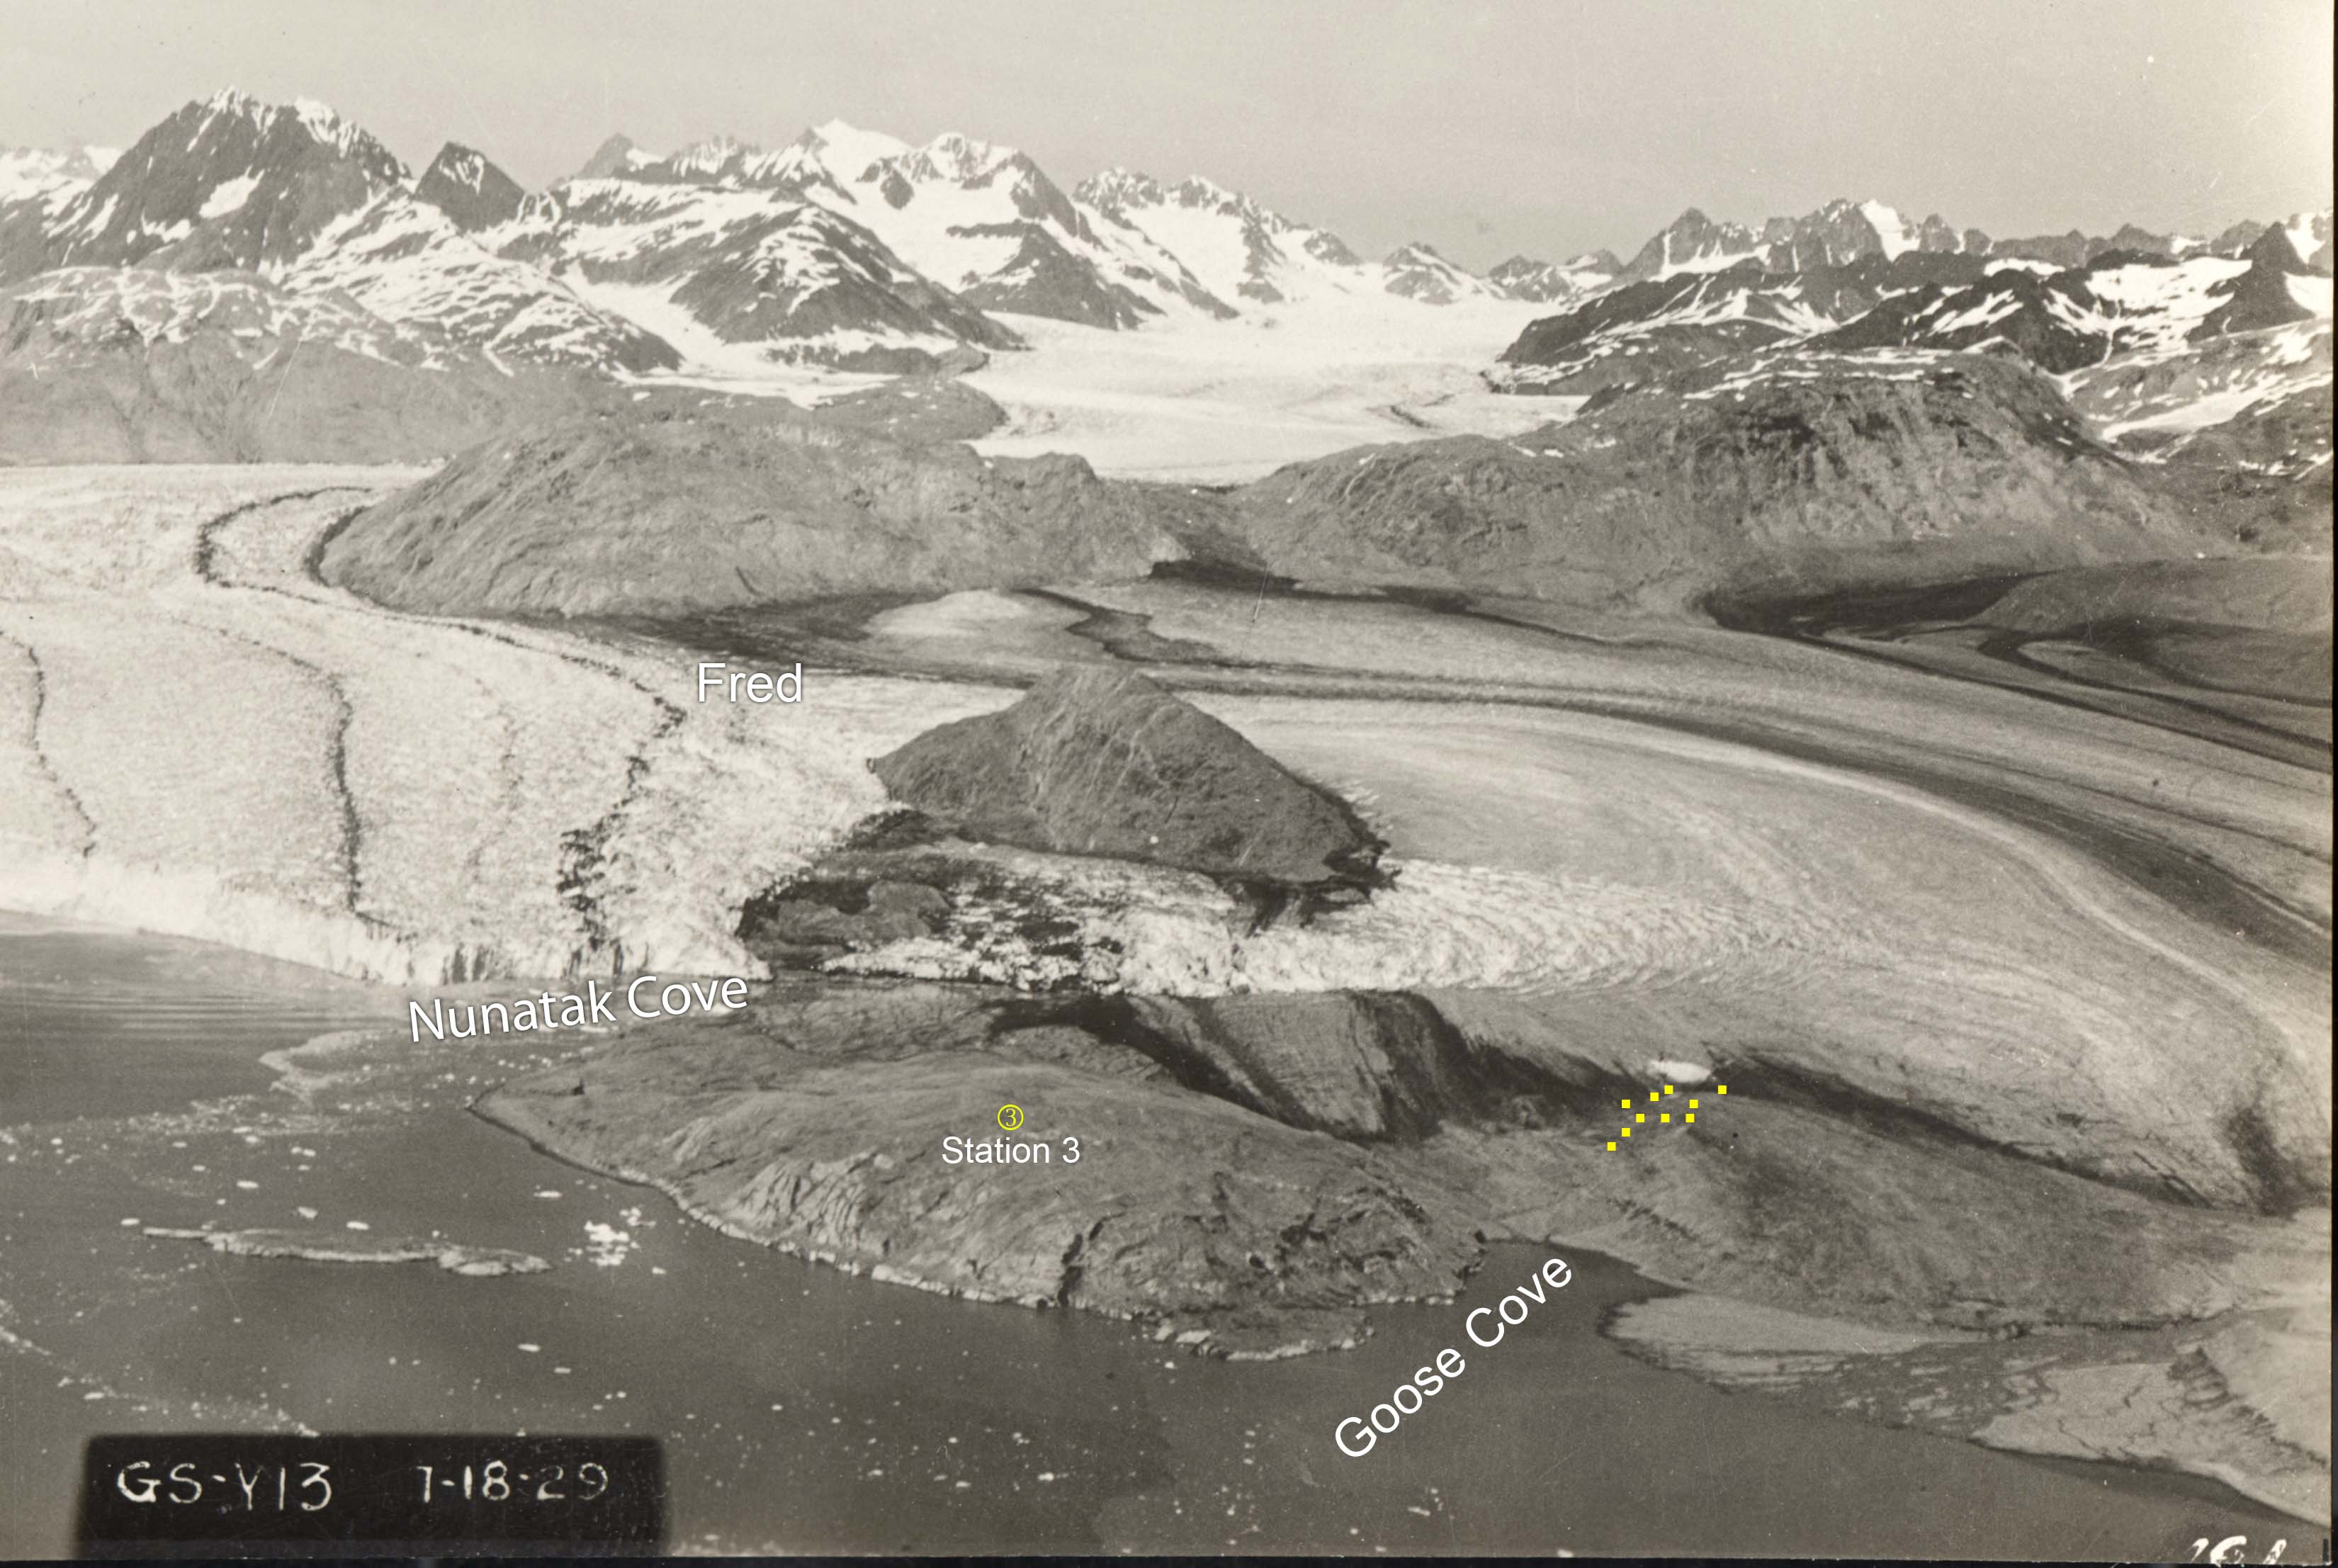
The Fred and Goose Cove study sites at Glacier Bay are only 4.2 km (2.7 miles) apart and the glacier exposed Goose Cove only about a decade earlier than Fred. The vegetation development at Goose Cove during the two decades after I established the plots (ca. 1990-2010) should be comparable to the most recent two decades of development at Fred (ca. 2000-2020). Precise comparisons require that I know how old the two sites are.
The second youngest of my 10 study sites at Glacier Bay is called Fred because there is a USGS benchmark there named Fred. Fred is dominated by alder. When the plots were established in 1988, there were no spruce and the average diameter of the cottonwood trees was 7 cm (2.8 inches). There were about five of these little cottonwood trees in each plot and 280 alder stems. There are 10 plots and we measured the diameter of all 2800+ stems.
The primary source I used to date Fred’s emergence from under the glacier was an aerial photo taken in 1948. The McBride remnant, a large extent of shrinking, stagnant ice, was 550 m away from the plots and I guessed that four years earlier the ice had probably covered the plots. I was probably off by a few years.
Continue reading “Dating Fred”Three decades ago I started monitoring vegetation change in Glacier Bay National Park where glaciers have been retreating and exposing new land to colonization by plants. Each of the 10 sites I study was exposed at a different date over the last 250 years and it’s important to know that date for each site. It seems even more important now that I have so much data from the sites.
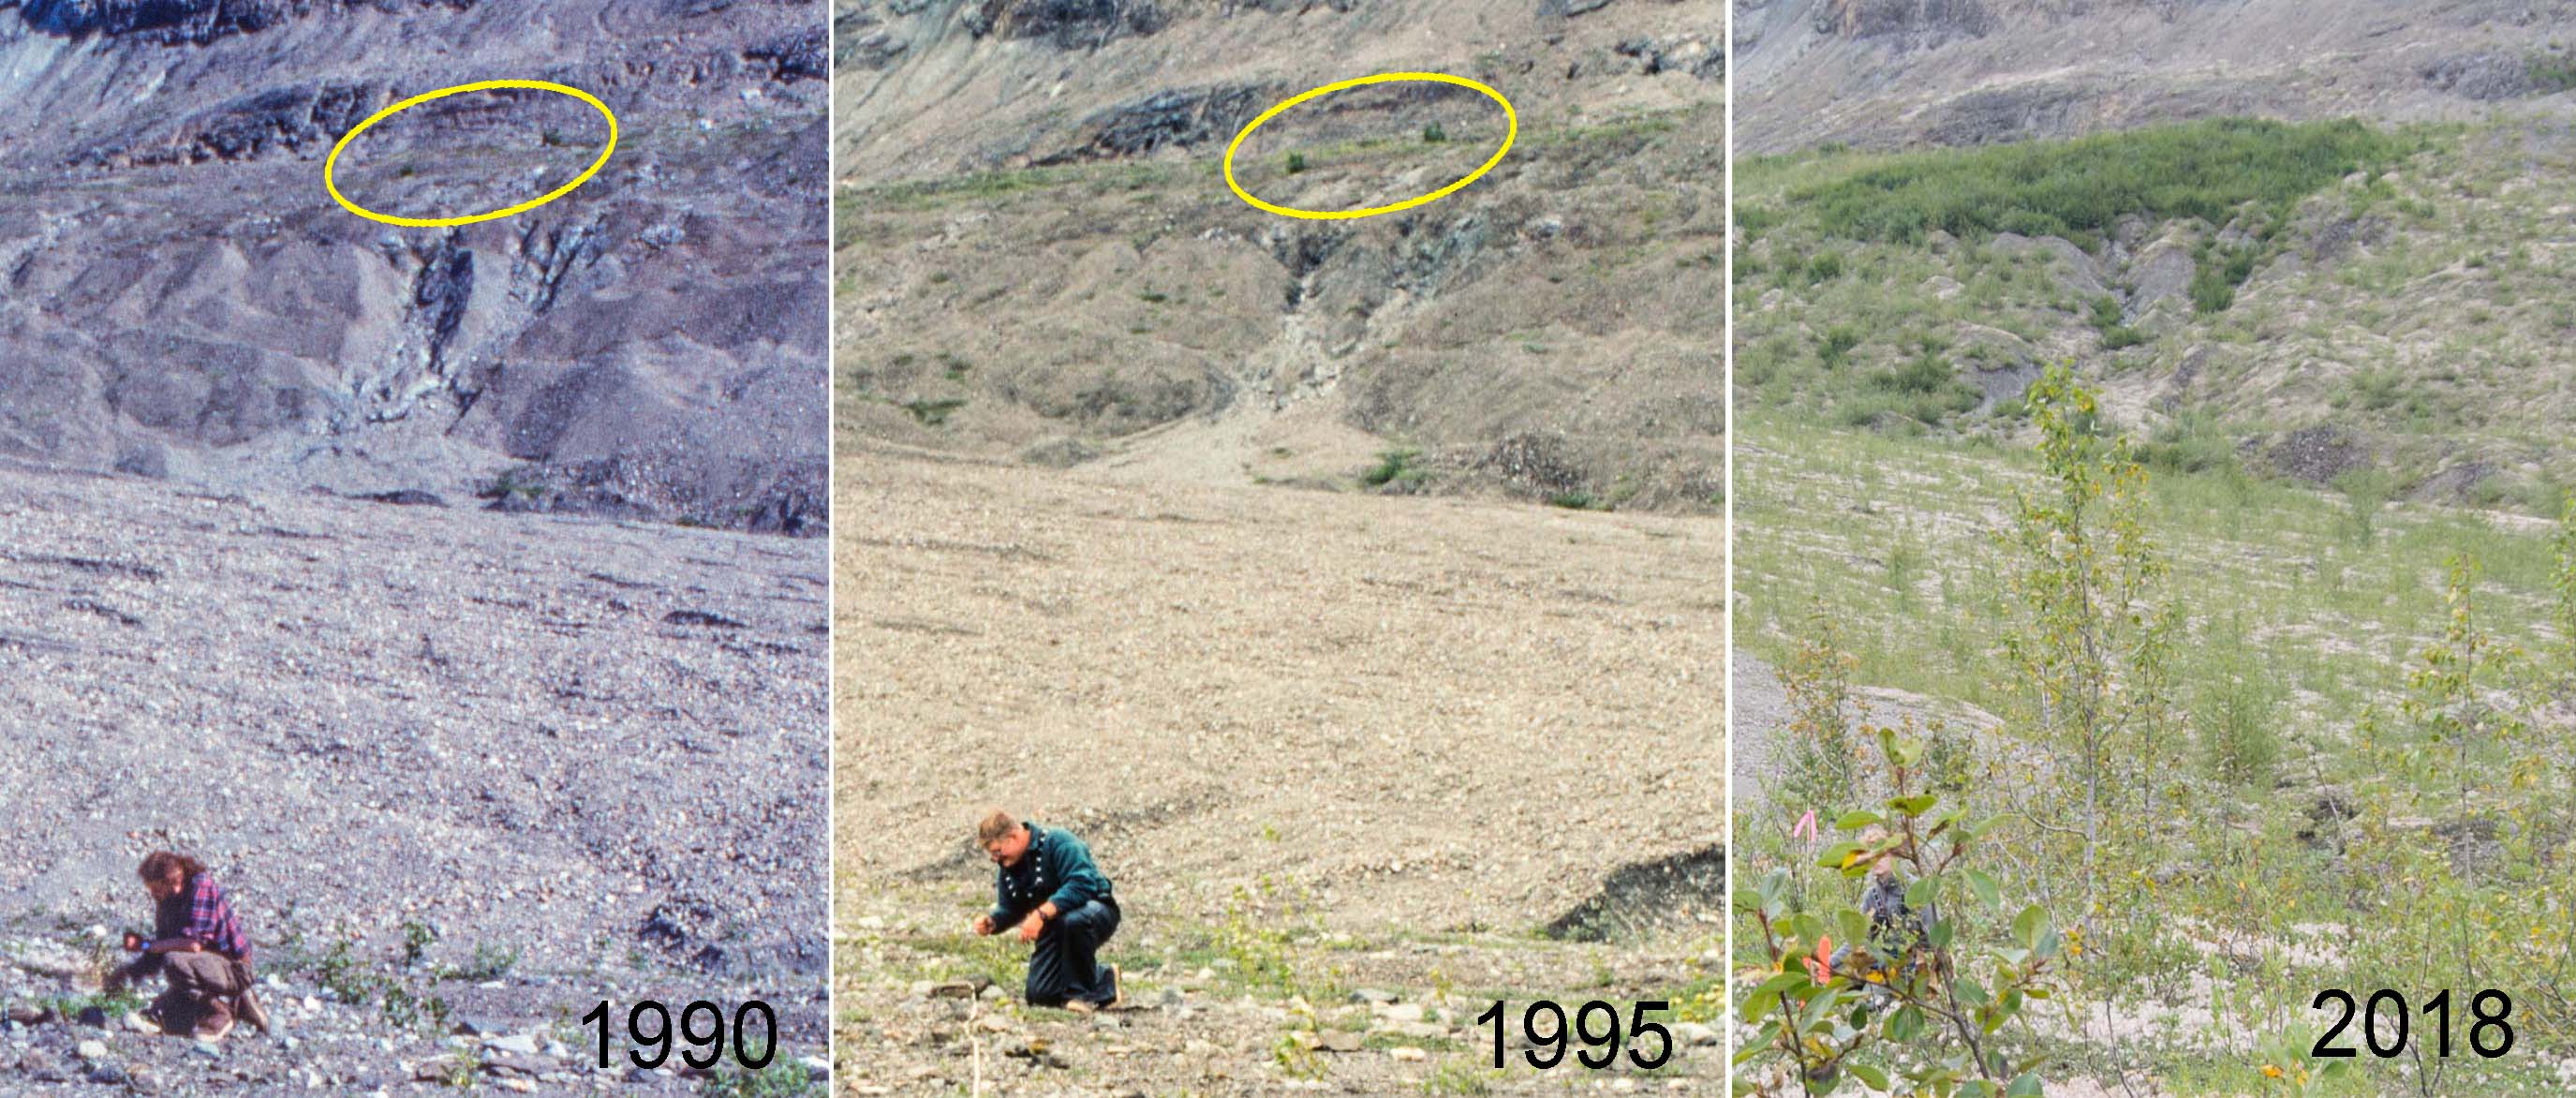
Some “then and now” sliders in the last post about Glacier Bay suggested that blueberry and hemlock were spreading in the understory at two of the older study sites we visited last month. Below I am trying out another method of displaying these pairs of old (1990 or 1995) and new (last month) photos. Some new photo pairs from York Creek and Beartrack Cove have been added as well as pairs from a third site.

Last month I was on a two week camping trip in Glacier Bay National Park collecting data from thirty-year-old study plots. We measured and counted the same things (tree diameters, number of alder stems) that we did in 1988, 1989, or 1990. I brought home lots of new data to compare to the old data, and also brought home 1600 new photographs.
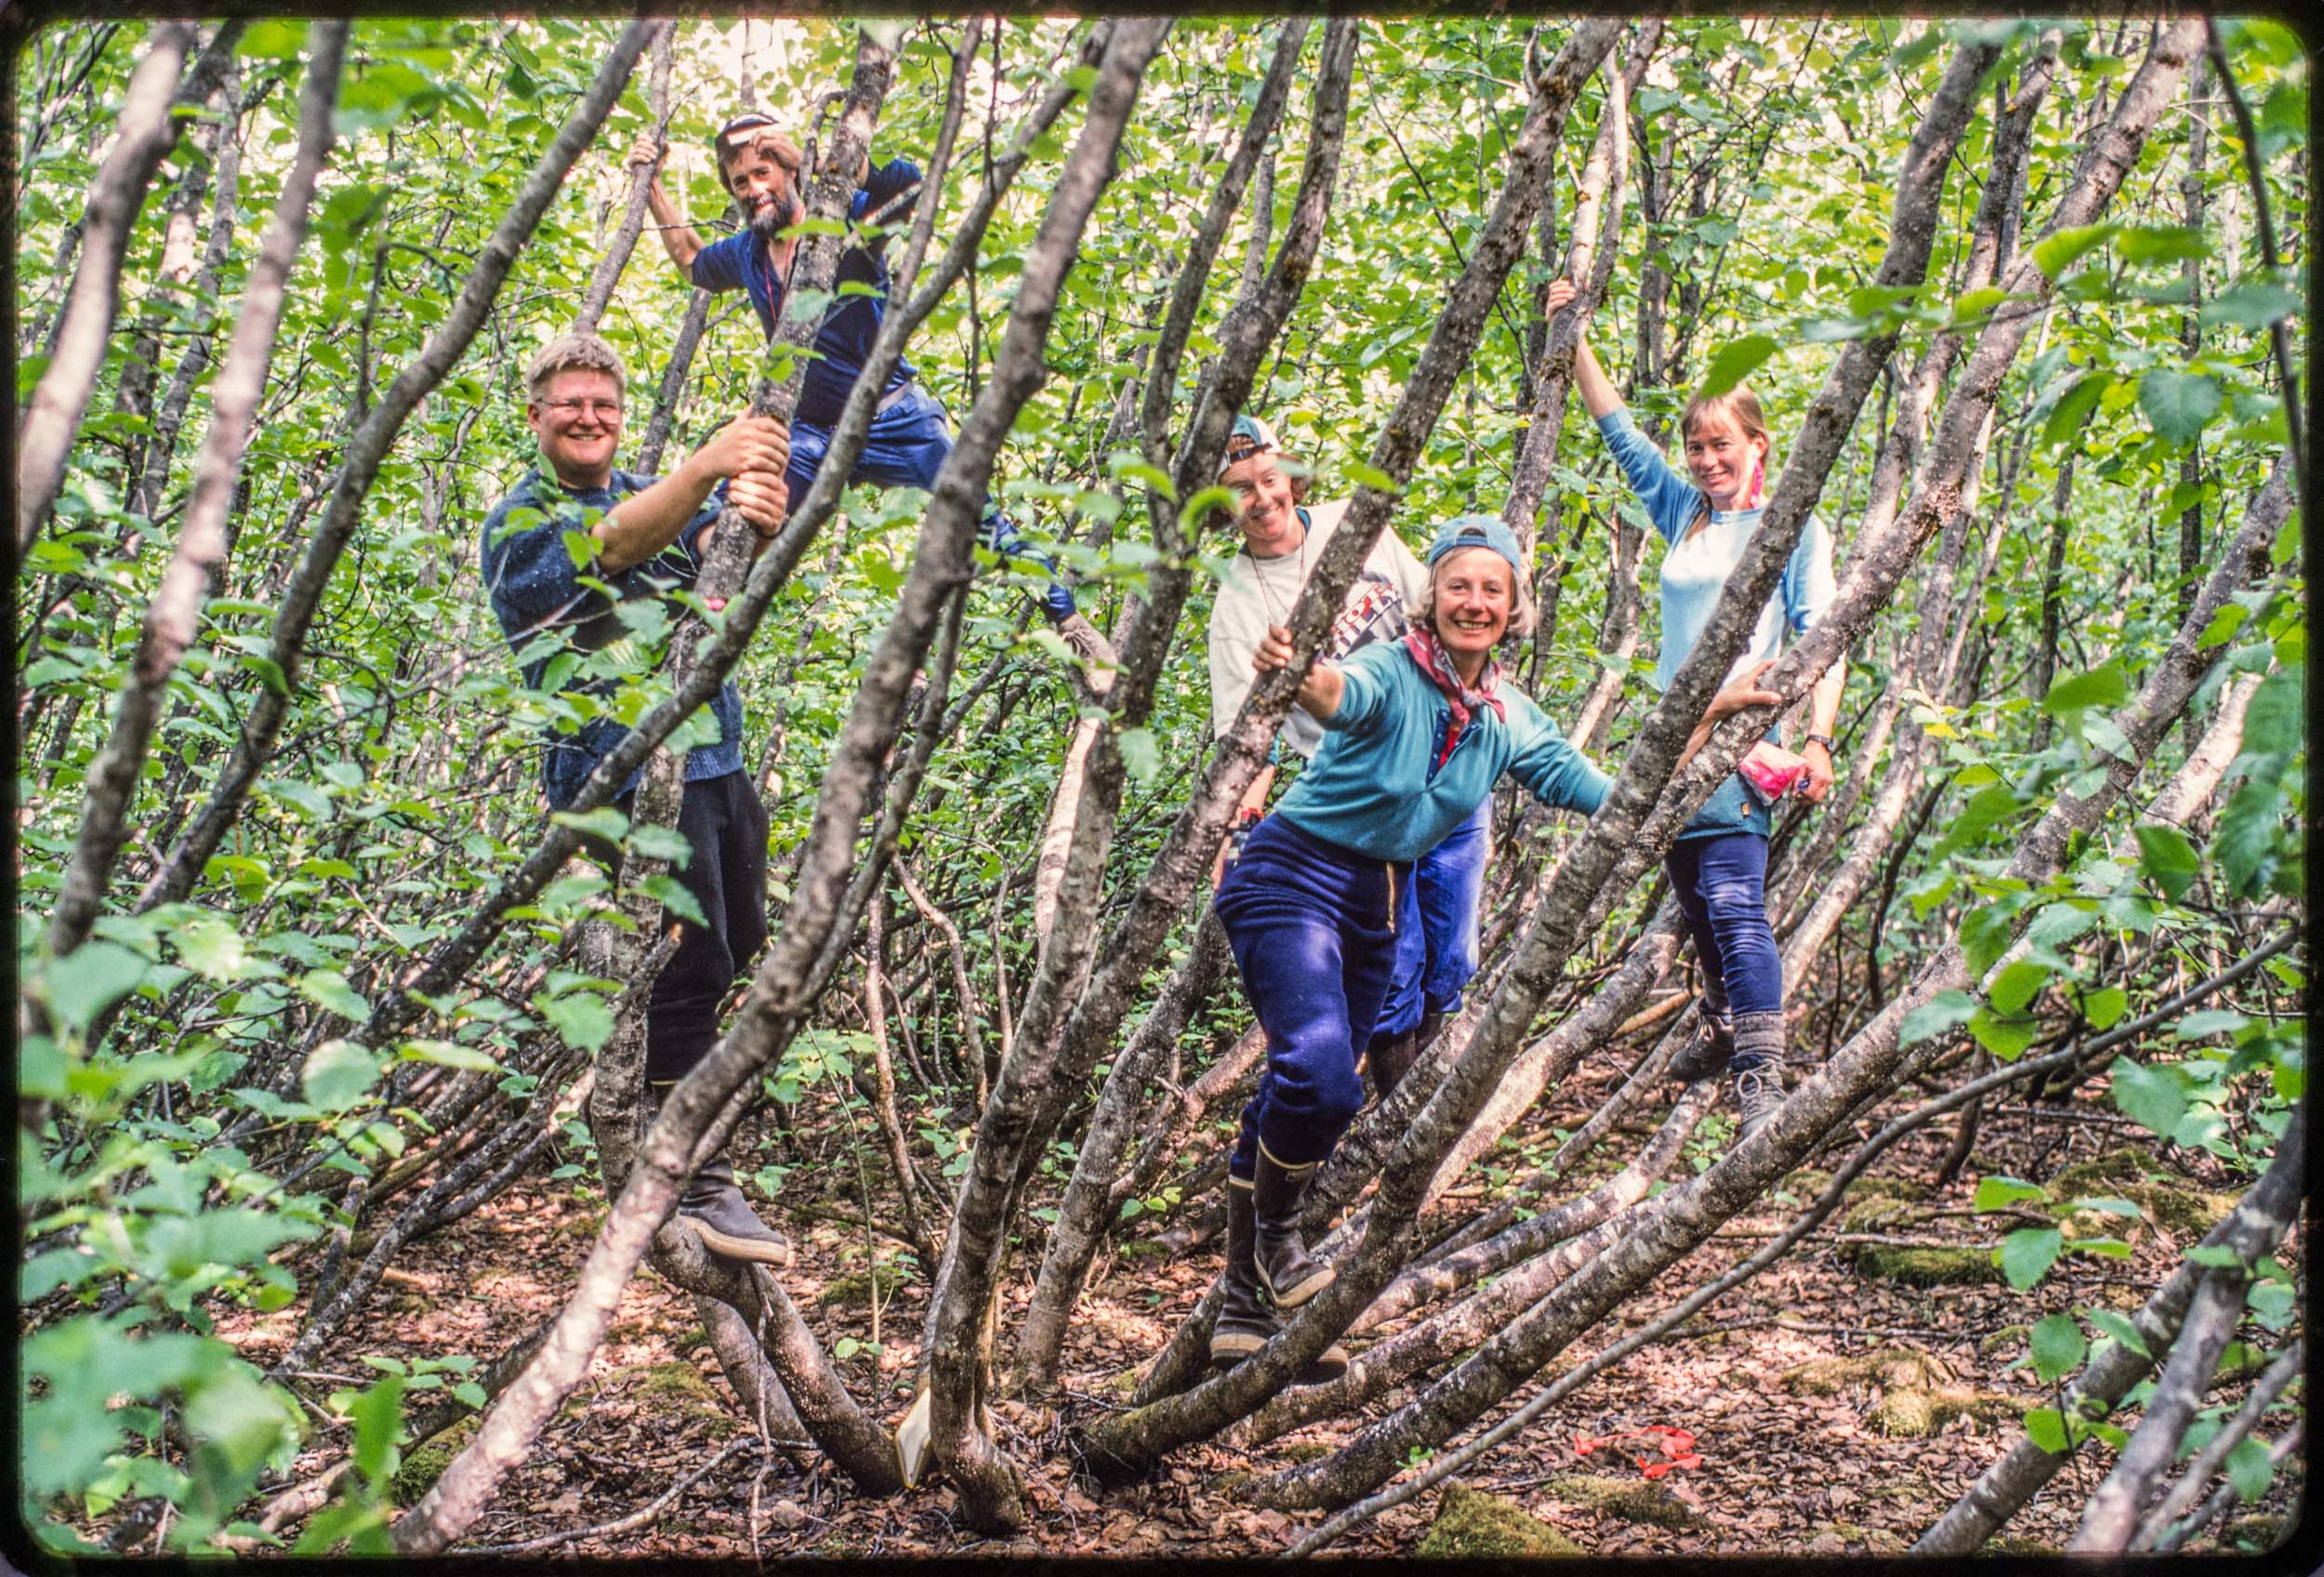
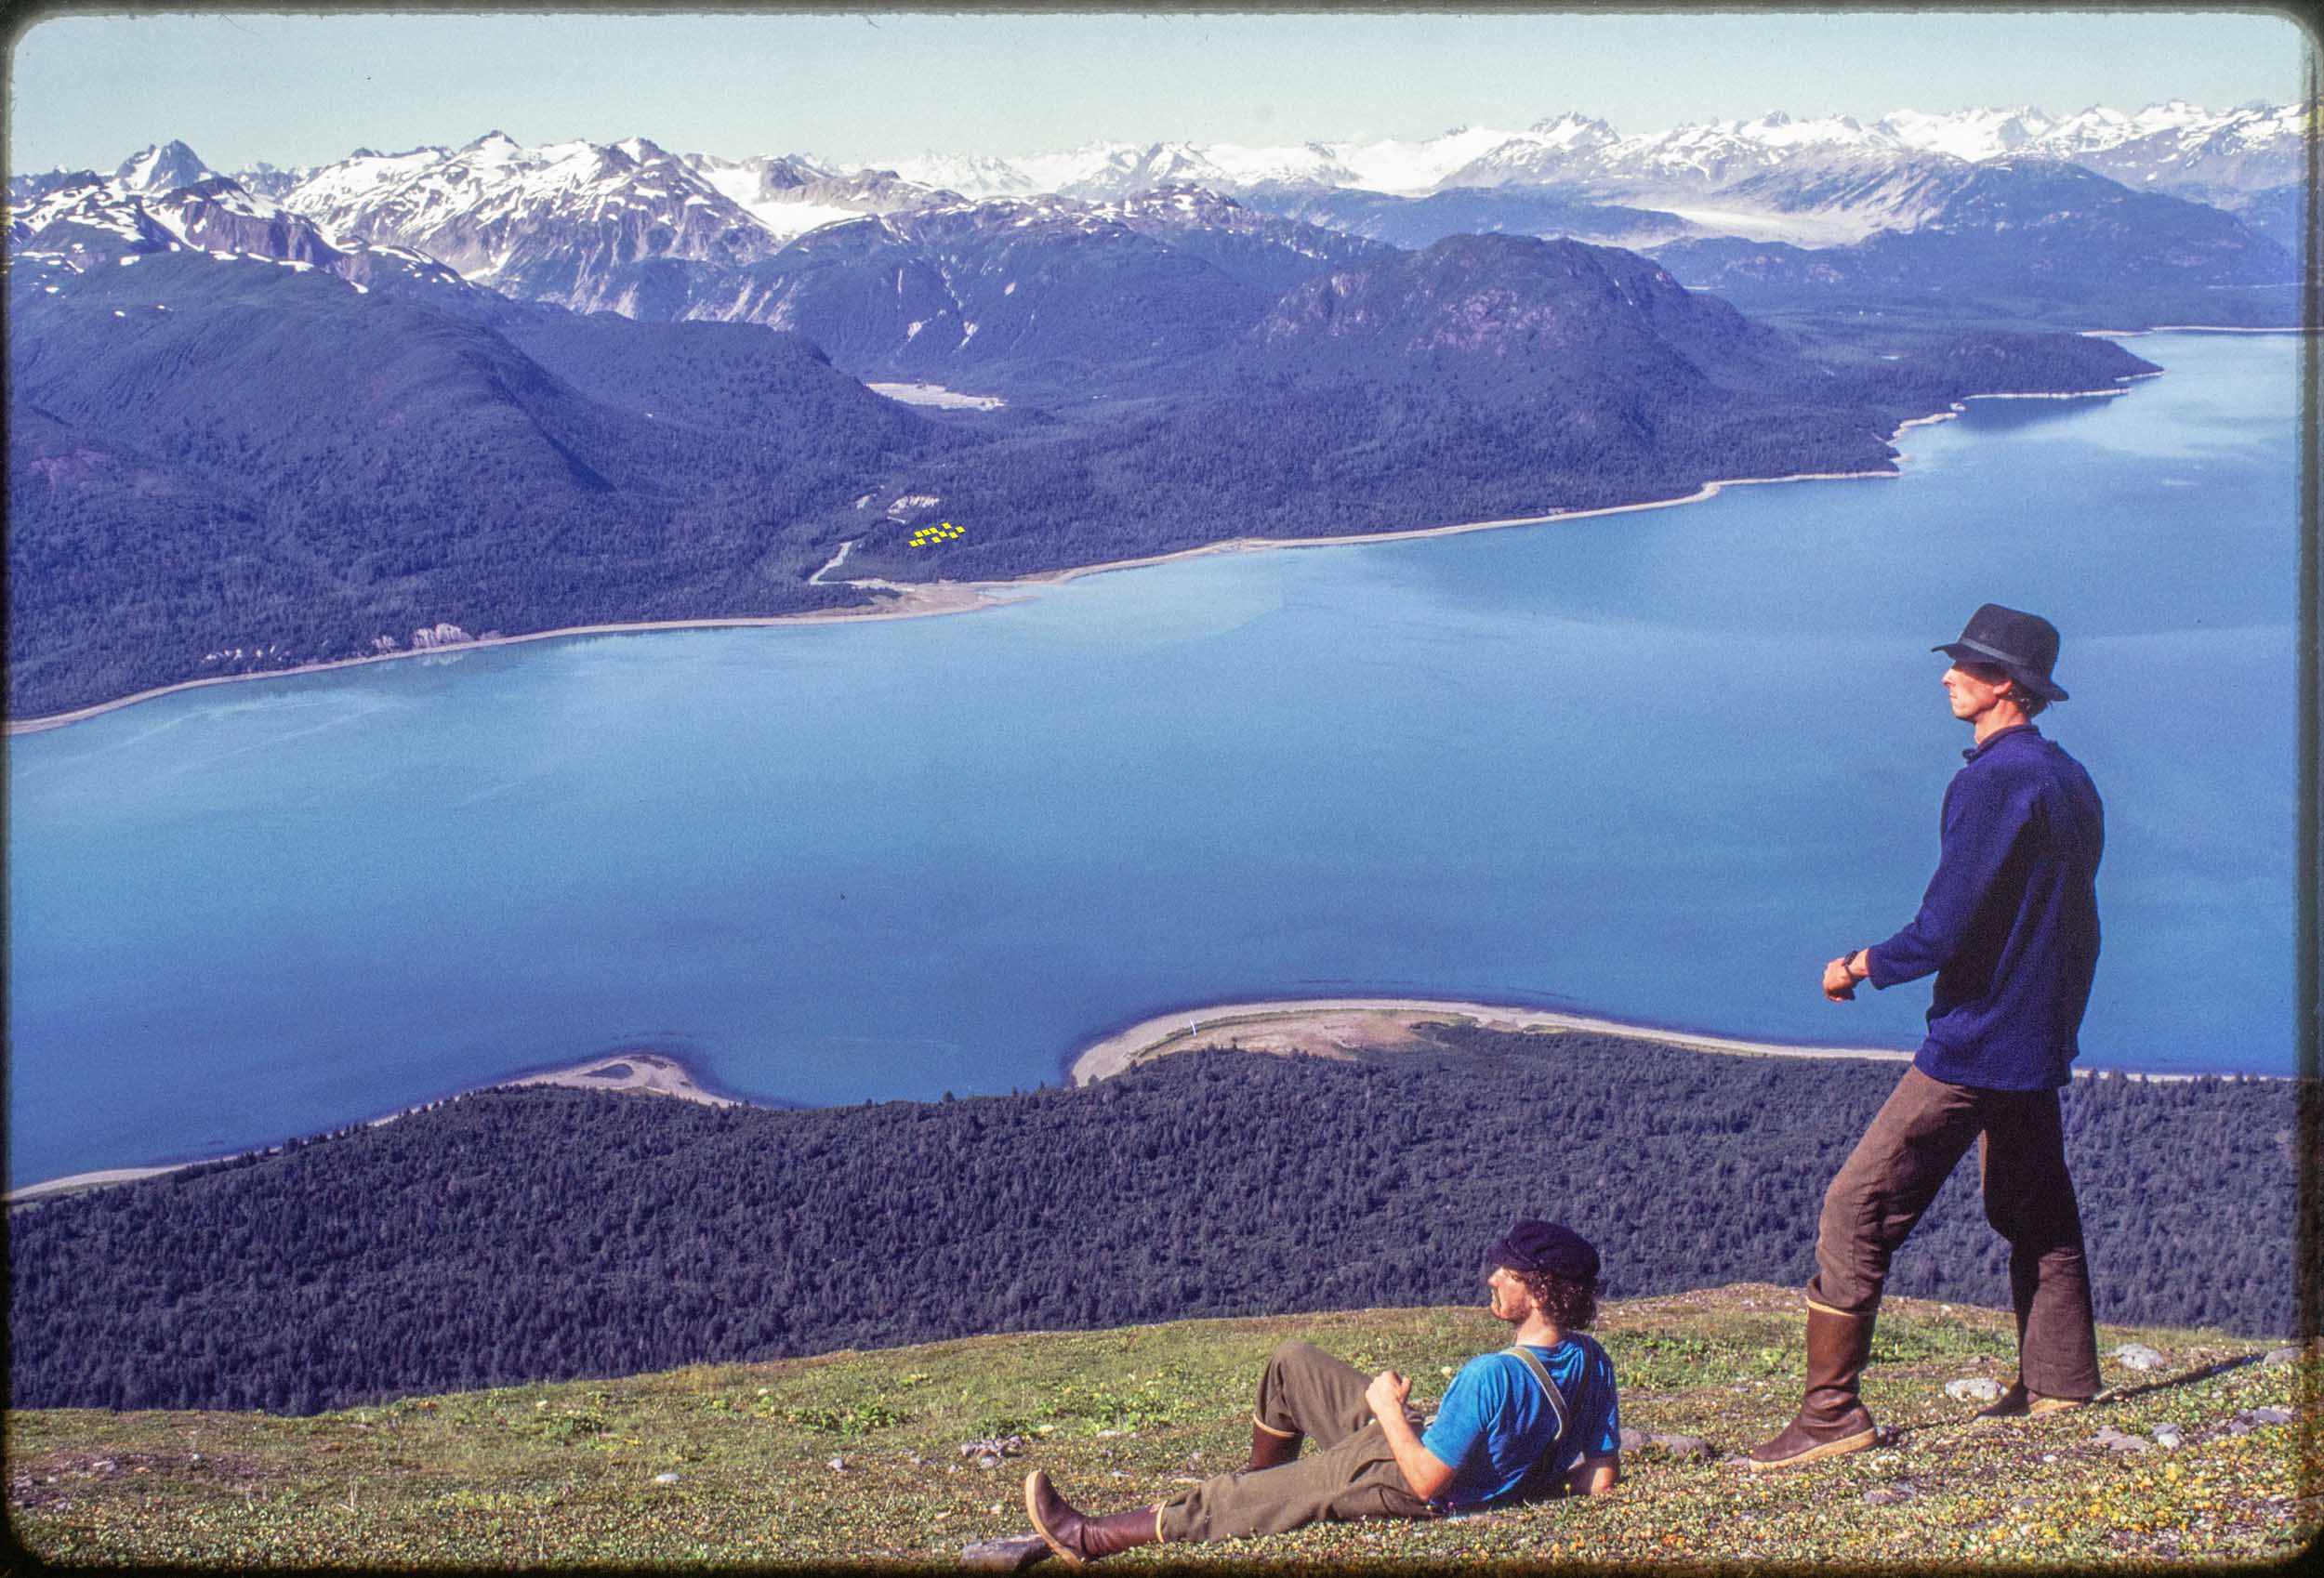
The photos are of four types: repeat photos of the study plots, natural history, scenery, and photos of the field crew trying to look like it’s not raining.

Very few Sitka alders established during the first two decades after the retreating Muir Glacier exposed my youngest study site (Site 1) at Glacier Bay. Older sites in Muir Inlet had abundant alder plants by the time the surface was 20 years old, and it seems likely that the difference was caused by a shortage of alder seeds arriving at the young site. Today there are a few alders at Site 1, and what they have done (or not done) in the last three decades suggests a more nuanced explanation.
The young vegetation on the north side of Upper Muir Inlet in Glacier Bay National Park is developing dramatically differently from older vegetation a few km away. Today, five decades after the retreating Muir Glacier exposed my youngest study site (Site 1) to plant invasion, it supports an open shrubland of willows with most of the ground still carpeted with low-growing Dryas drummondii. At the same age (in 1995), the next older site (Site 2) had no Dryas and was a dense thicket of 6 meter tall Sitka alder shrubs. The distinct successional pathways being followed at these sites have critical ecological differences (e.g., alder is an important nitrogen fixer) and suggest that inferring ecological change from a sequence of different aged sites in this part of Glacier Bay does not work.
My favorite hypothesis to explain this is that early seed rain of alder differed between the two areas. Ice margins in Glacier Bay have been retreating to the north for almost three centuries, and invading newly exposed terrain requires that plants can migrate as fast as the ice retreats. Alder was apparently doing a good job of chasing the ice along most of Muir Inlet where my reconstructions of invasion histories at four study sites confirm that alder was an important early invader.
Continue reading “When alder can’t keep up”In the late 1980s, I established vegetation study plots at 10 sites along the eastern side of Glacier Bay in southeastern Alaska. These sites were more or less evenly spaced between the retreating Muir Glacier and the terminal moraine which the Glacier Bay ice had built at the end of the Little Ice Age. The youngest site had been exposed by retreating ice in 1968 and the oldest site had been exposed around 1770 soon after the ice melted back from the 1740 moraine. So on average the age difference between “consecutive” sites was about 20 years (202 years ÷ 10).
There are three approaches to learning things from this series of different aged study sites:
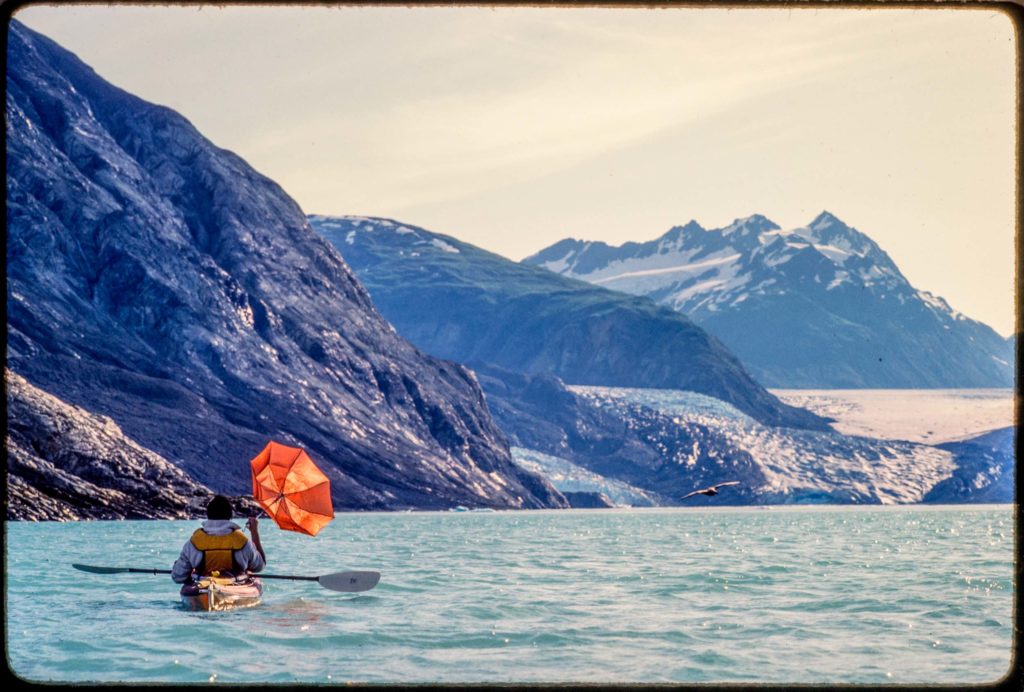
I saw Riggs Glacier on my first trip to Glacier Bay in 1984. Of the three tidewater glaciers in Muir Inlet at that time, only McBride Glacier reaches sea level today. In 1990, as one of the final field tasks for my dissertation, I established permanent study plots between Riggs Glacier and Muir Glacier. This summer Galen and I used old sketch maps to find all five of them and recorded GPS coordinates.