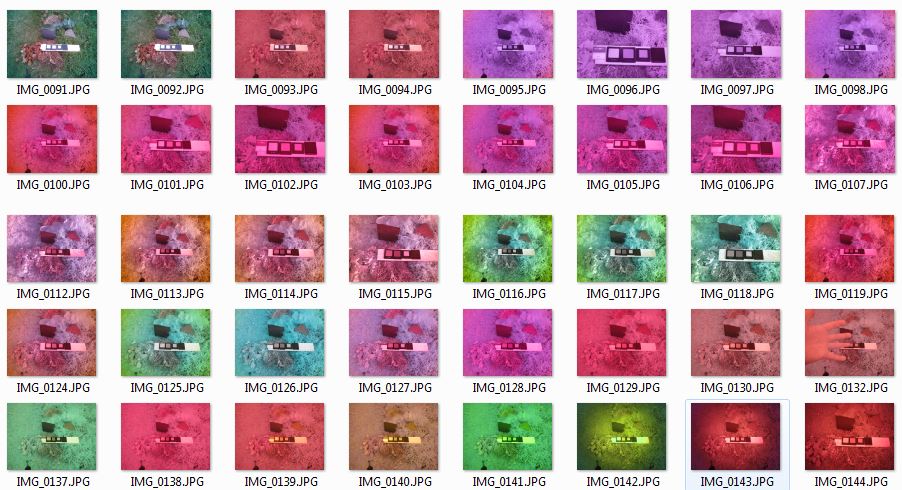
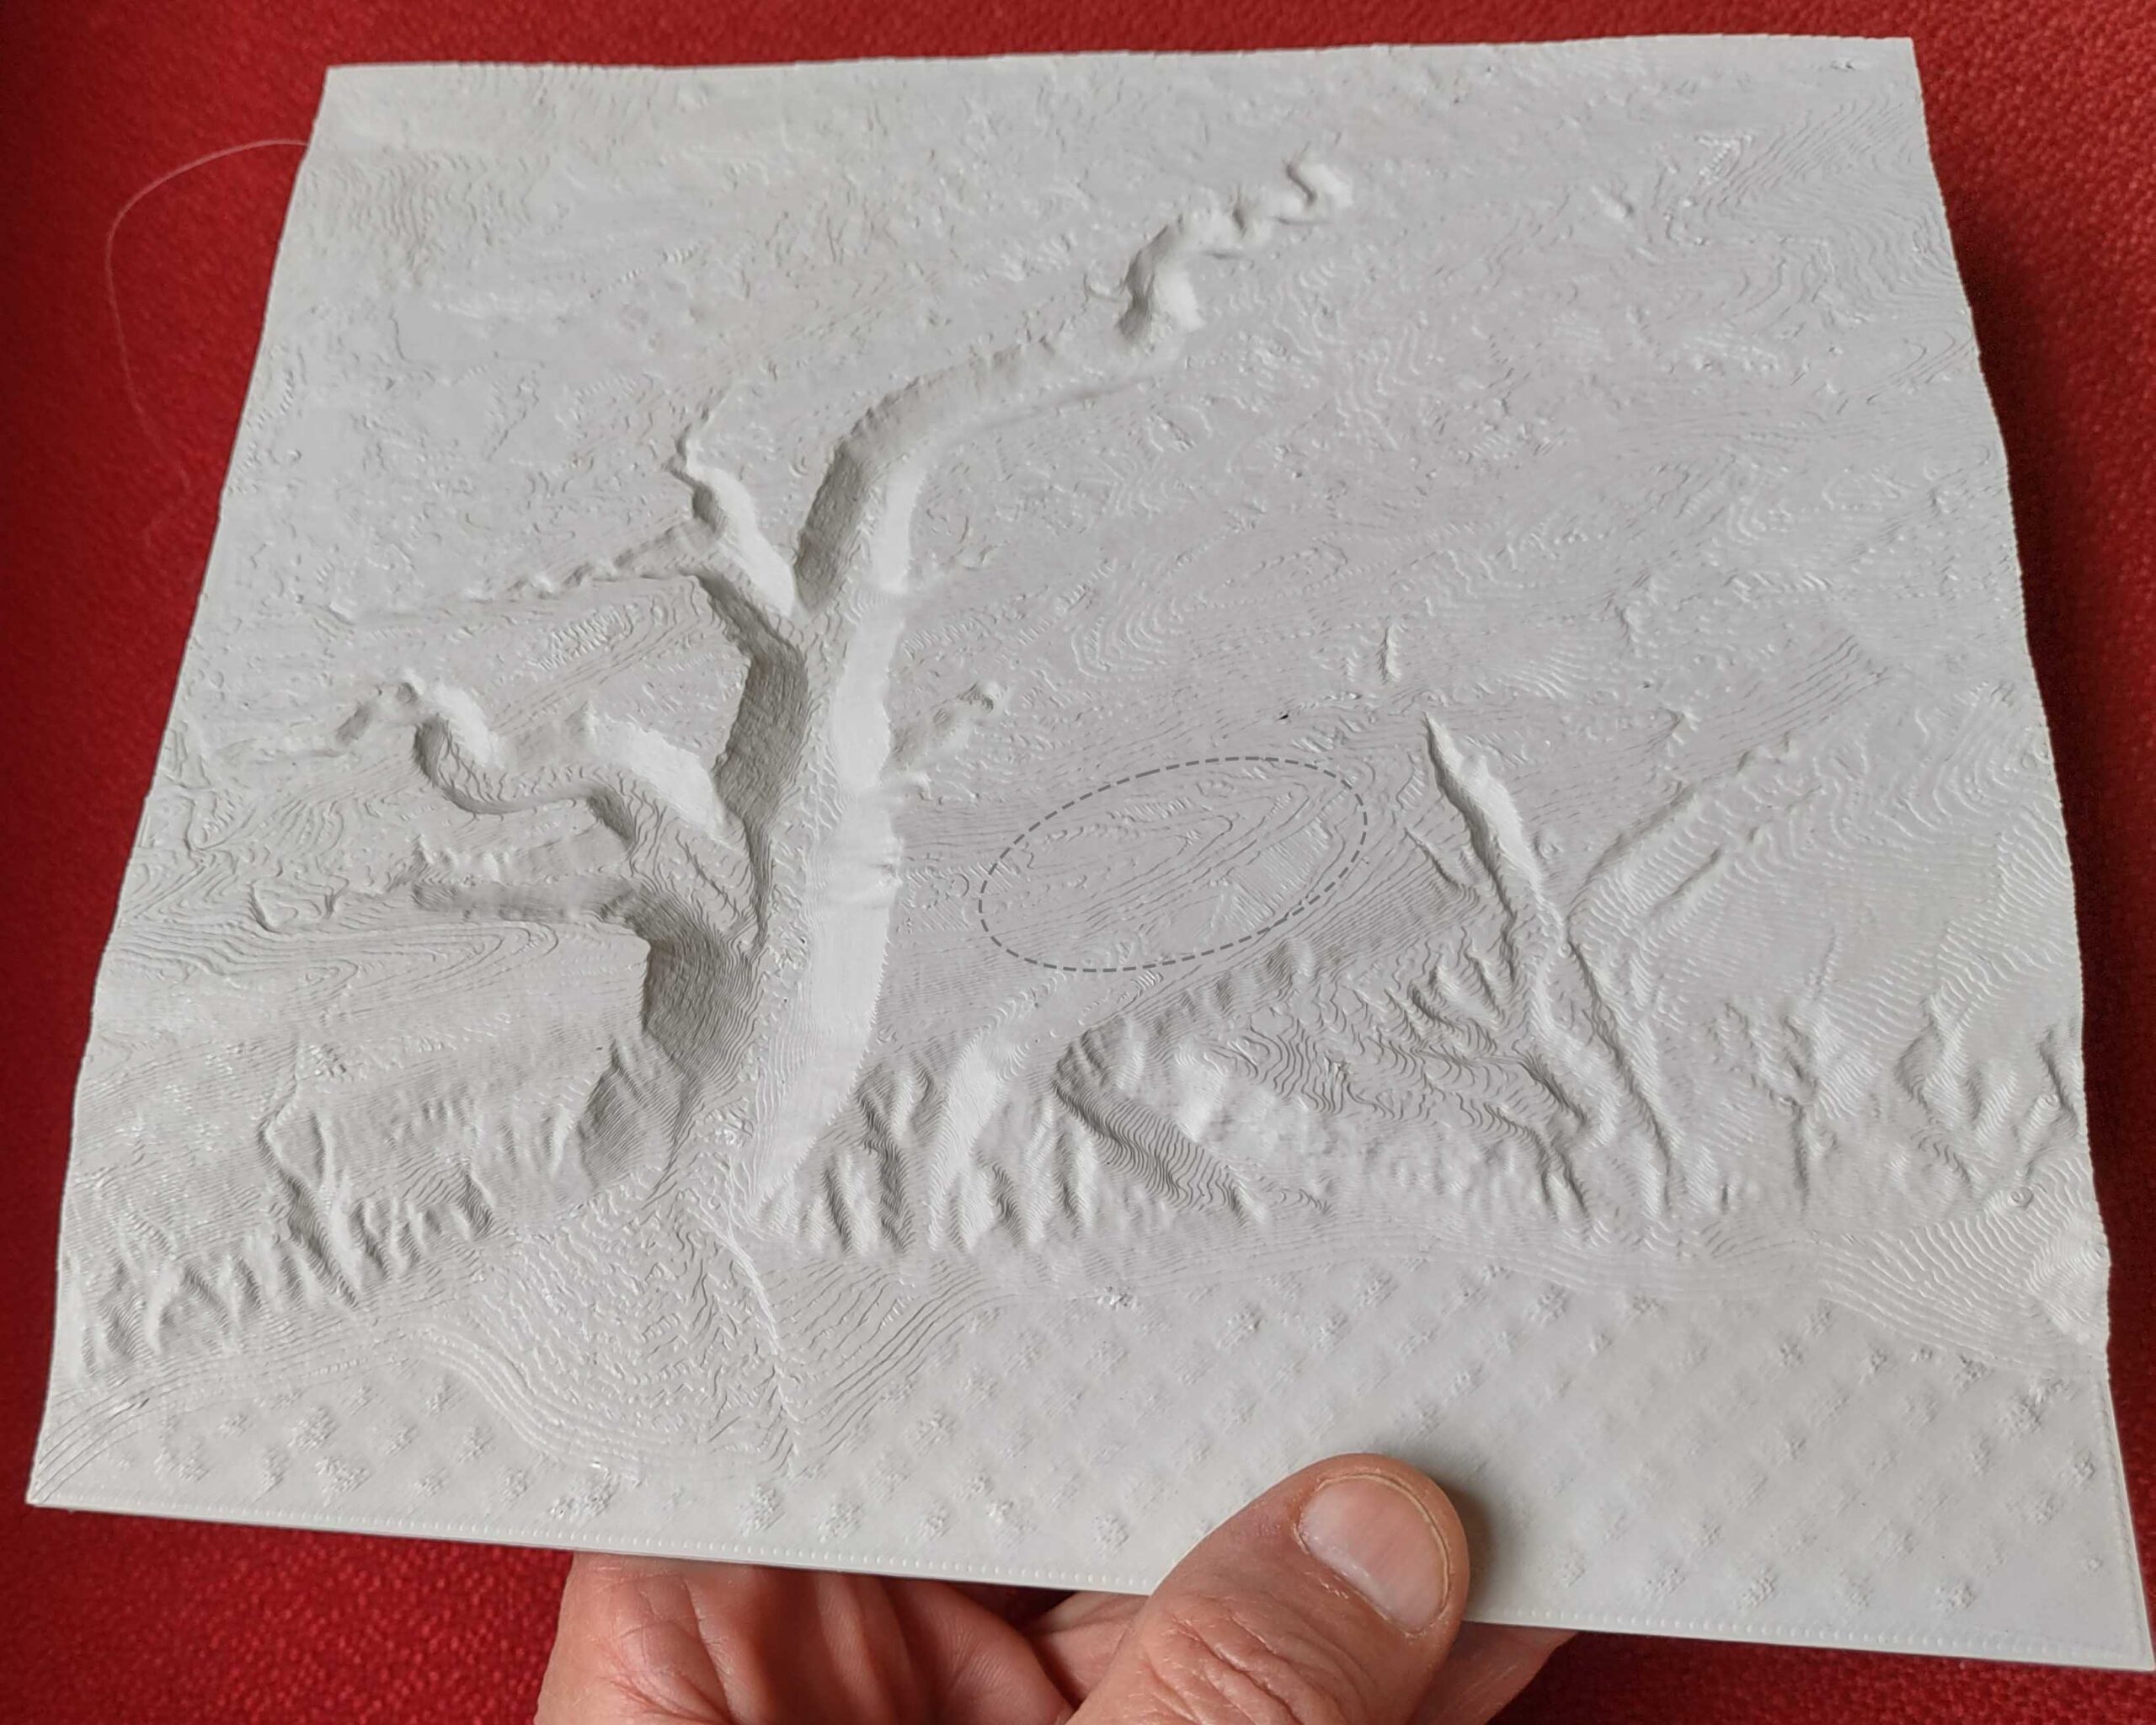
LiDAR datasets allow us to work with digital facsimiles of the earth surface and its adornments (e.g., vegetation). It’s also possible to transform the digital models back into physical form. I have been trying this with my 3D printer.
At the end, I am at home in the woods
LiDAR datasets allow us to work with digital facsimiles of the earth surface and its adornments (e.g., vegetation). It’s also possible to transform the digital models back into physical form. I have been trying this with my 3D printer.
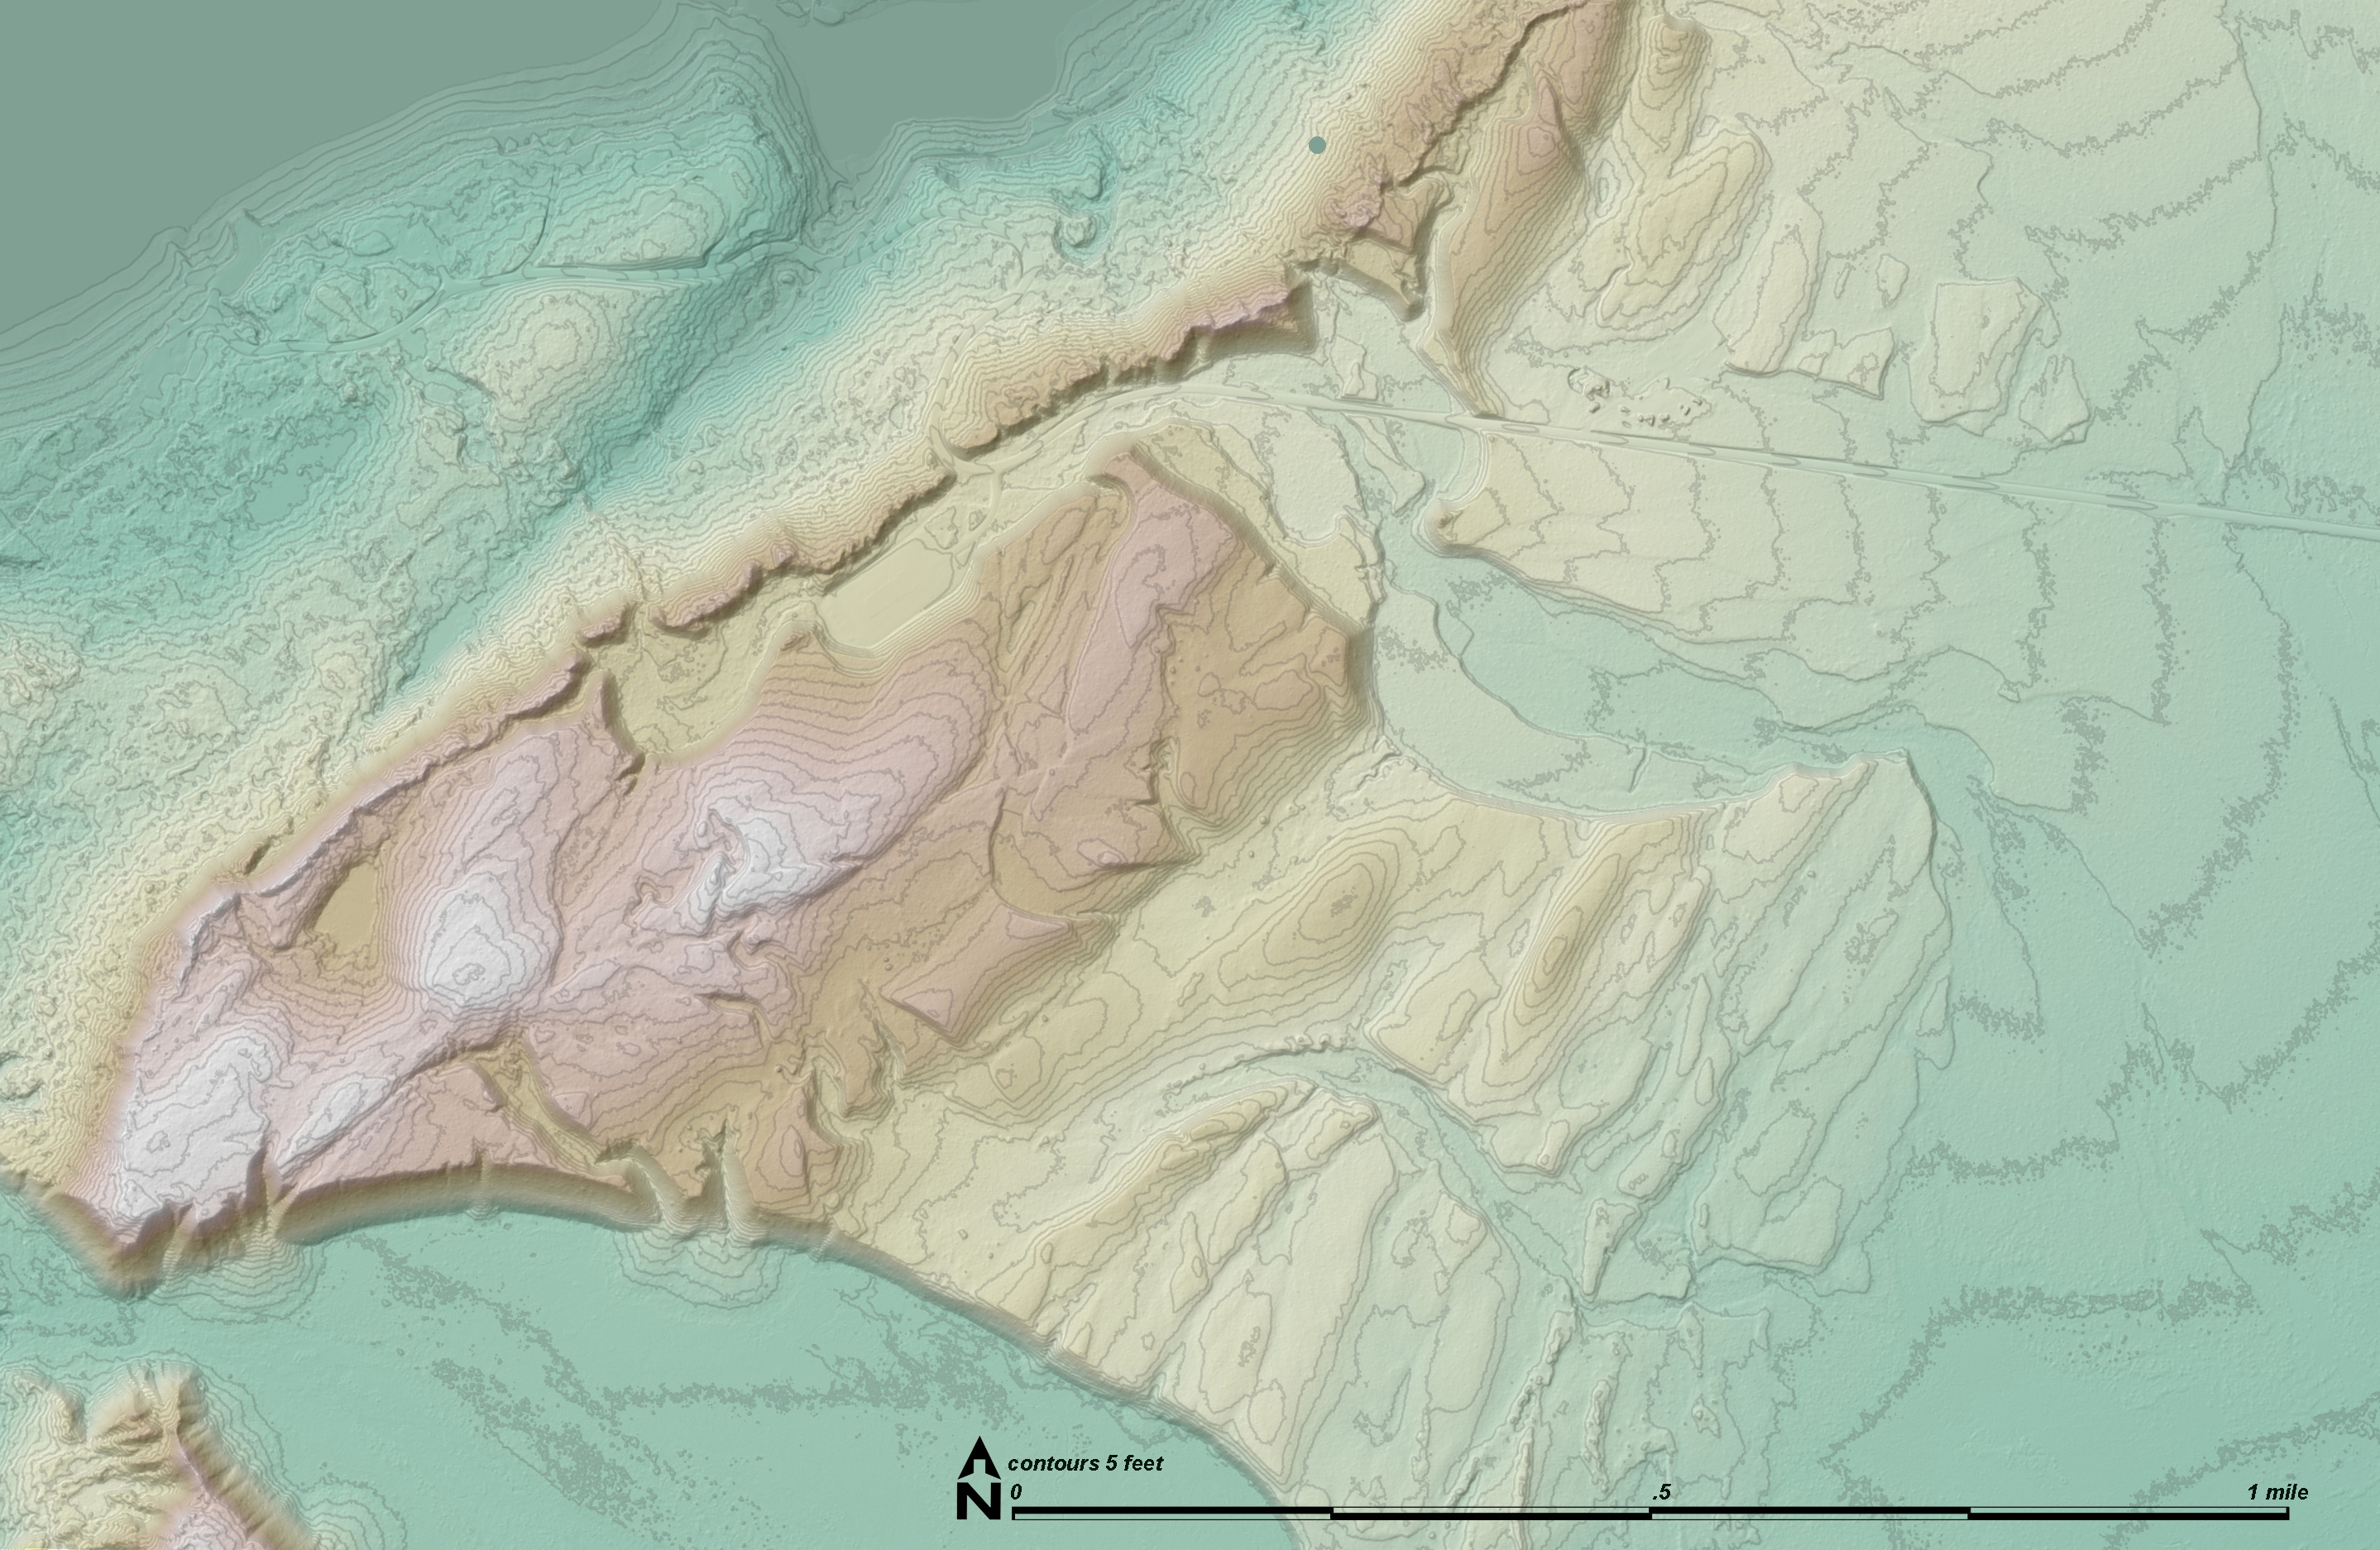
The new LiDAR dataset for Glacier Bay includes not only the “bare earth” digital terrain model but also the point cloud which can represent vegetation and other things the airplane-borne LiDAR bounced off first before it bounced off the ground. This “first returns” cloud can show the shape of the upper vegetation canopy and even distinct understory strata. I have been trying to determine if any useful information can be quantified from the point cloud and to use QGIS to make colorful 3D images of the canopy models.

In 2019 Glacier Bay National Park paid to have LIDAR mapping data collected for about a third of the park. Last summer the processed data were delivered and have now started to appear online for downloading. Most of the data are good quality (6.14 points/meter²) and the area around Park Headquarters and two areas of the outer coast (Pacific coast) are better quality (16.52 points/meter²).
Last spring, Barry Warzak of Midwest Optical Systems (MIDOPT) in Illinois contacted Ned Horning about writing an article on dual bandpass filters. Ned got me involved, and Barry also became interested in having us try some of the new filters he was developing. The primary focus of MIDOPT is industrial machine vision filters and lenses, but Barry recognizes the potential in the emerging market for agricultural analysis and aerial imaging. Barry has sent us samples of 15 different filters that could be used for infrared plant health analysis. Some of these are fancy dichroic filters that transmit one or two very narrow bands of color, and others are high quality glass filters that have spectral qualities similar to Wratten 25A, Wratten 15, or Schott BG3 filters.